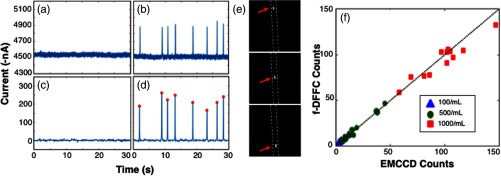
Fig. 2.
Example data traces collected from the surface of an optical phantom (a) without and (b) with fluorescent microspheres. We performed signal processing as described in the text (c) and (d) and identified peaks (red circles). We also (e) imaged bare tubing with an EMCCD camera to obtain independent measurements of microsphere numbers. Dotted lines represent the approximate location of the tubing. Frames shown were separated by 250 ms. (f) The number of spheres counted with the fiber-DFFC and EMCCD systems in 5-min scans is shown, indicating excellent agreement between the methods.

