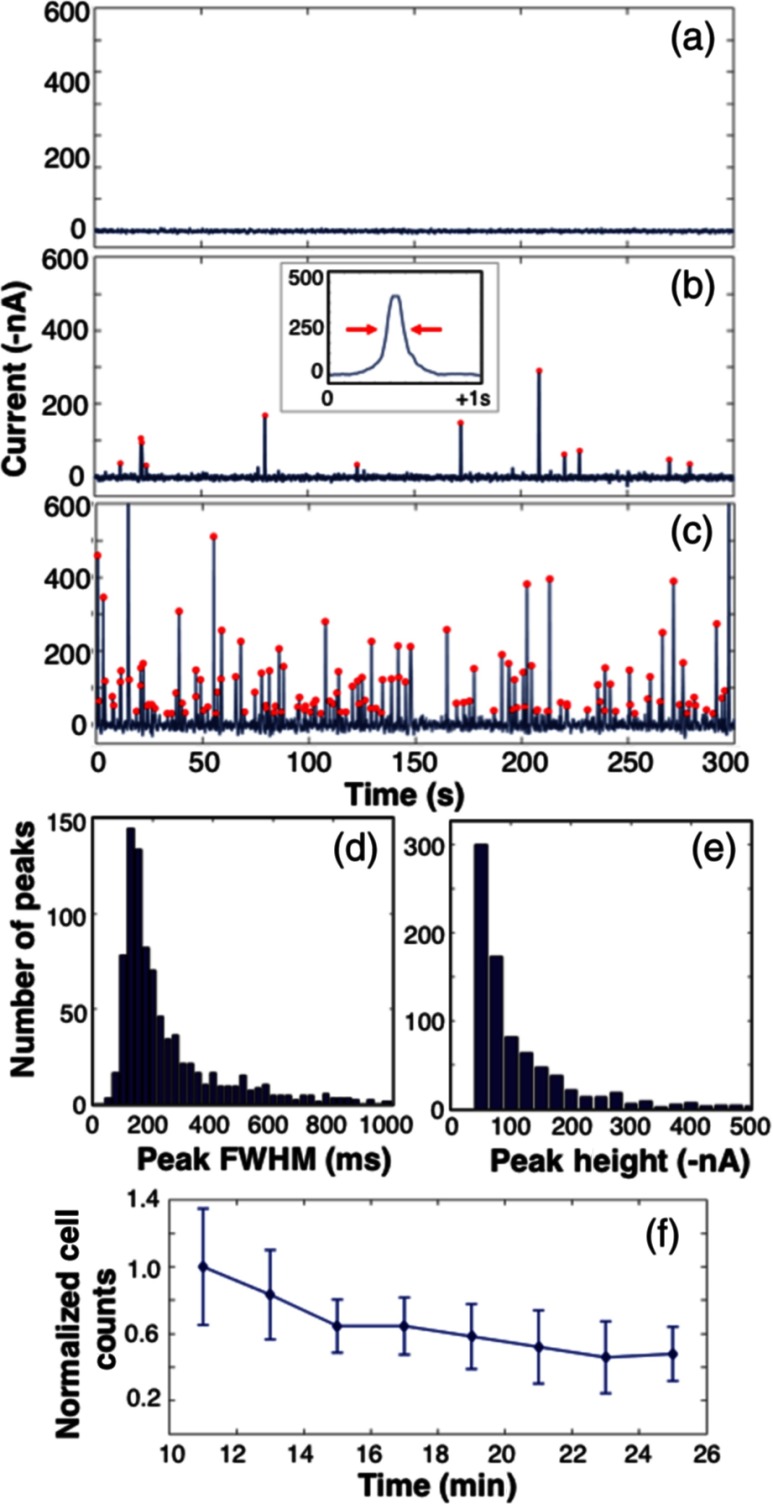
Fig. 3.
Example 5-min data traces measured from (a) uninjected control mice, and mice injected with (b) or (c) fluorescently labeled MM cells. Red circles indicate detected peaks. An example spike is shown inset in (b). The distribution of peak (d) widths and (e) amplitudes is shown. The (f) normalized cell count as a function of time after injection is shown.

