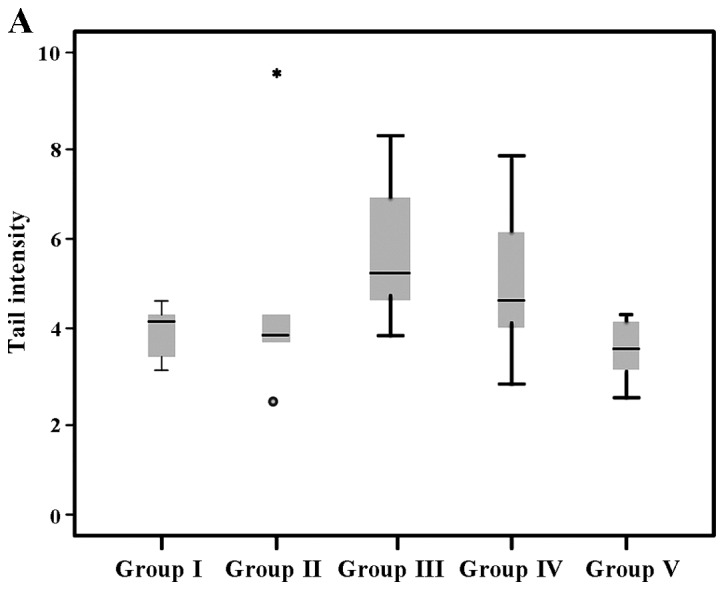
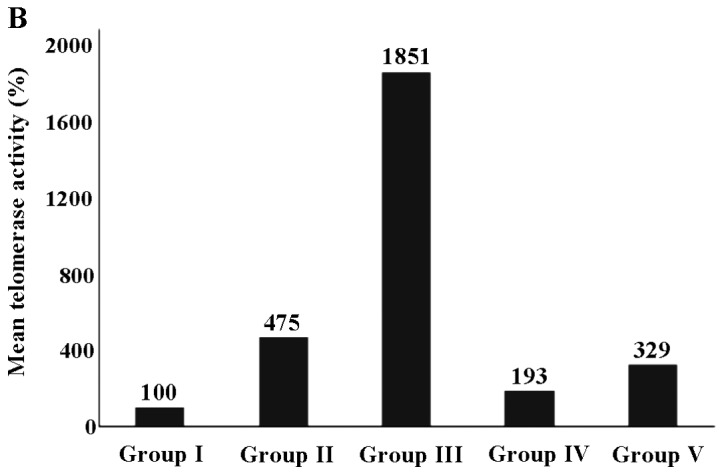
Figure 1.


(A) Tail intensity and (B) telomerase activity (%) of stanozolol and propylene glycol (PG)-exposed groups. Group I, control; group II, PG; group III, stanozolol; group IV, PG treatment and exercise; group V, stanozolol treatment and exercise. Extreme outliers are indicated by an asterisk (*) and circle (º).
