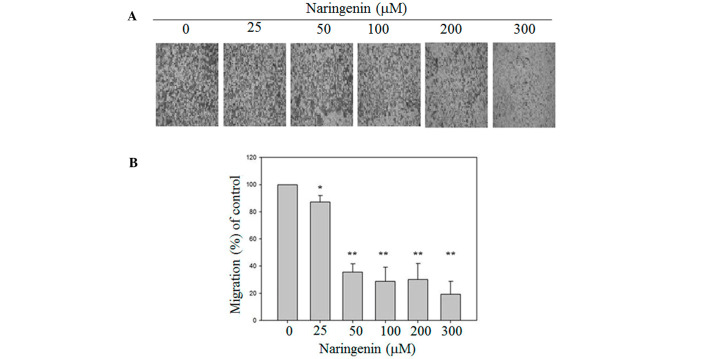
Figure 3.
Naringenin reduced the migration of A549 cells. The cells were treated with different concentrations of naringenin as described in Materials and methods. (A) Migrated cells were stained with Giemsa and images were captured under a phase contract microscope (magnification, ×100). (B) Data are represented as the mean ± standard deviation obtained from at least three independent experiments. The migration of the control was set to 100%. *P<0.05 and **P<0.001 vs. control group.

