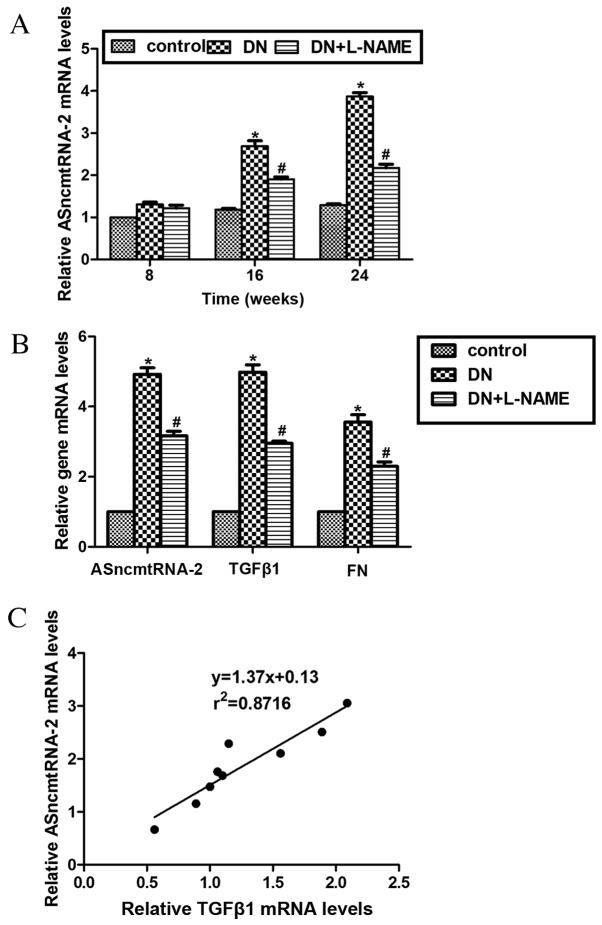
Figure 2.
Expression of ASncmtRNA-2 is upregulated in DN and reduced by L-NAME. (A) RT-qPCR analysis revealed the expression of ASncmtRNA-2 in the mice model at weeks 8, 16 and 24. Expression of ASncmtRNA-2 was increased in mice with DN but reduced by L-NAME in a time-dependent manner. (B) Mice in each group were sacrificed at 24 weeks, and total RNA was isolated and assessed via RTq-PCR analysis to measure the mRNA levels of ASncmtRNA-2, TGFβ1 and FN. mRNA expression levels of ASncmtRNA-2 were increased in DN samples, but were subsequently decreased by L-NAME administration. mRNA levels of TGFβ1 and FN displayed similar expression patterns. (C) Linear regression analysis suggests the mRNA levels of ASncmtRNA-2 are positively correlated with that of TGFβ1 in the experimental model of DN. n=9 (one mouse died prior to week 24). r2=0.8716.*P<0.05, DN vs. control; #P<0.05, DN + L-NAME vs. control. ASncmtRNA-2, antisense mitochondrial non-coding RNA-2; DN, diabetic nephropathy; L-NAME, NG-nitro-L-Arginine methylester; RT-qPCR, reverse transcription-quantitative polymerase chain reaction; TGF, transforming growth factor; FN, fibronectin.

