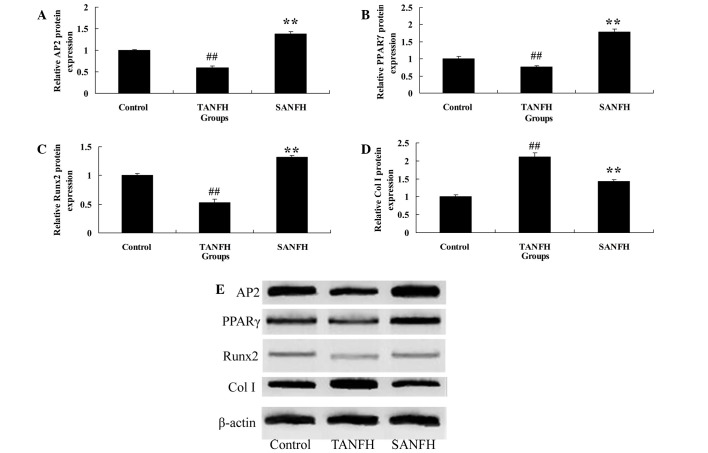
Figure 3.
Relative protein expression levels of (A) AP2, (B) PPARγ, (C) RUNX2 and (D) Col I in mesenchymal stem cells in the different groups. (E) Western blot analysis demonstrating the expression levels of the various proteins, with β-actin used as a loading control. ##P<0.05 vs. control group; **P<0.05 vs. TANFH group. AP2, adipose-specific 422; TANFH, trauma-induced avascular necrosis of the femoral head; SANFH, steroid-induced avascular necrosis of the femoral head; PPARγ, peroxisome proliferator-activated receptor-γ; Col I, collagen type I.

