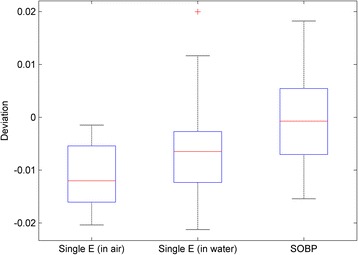
Fig. 5.

Validation of the model by the measurements. The first box plot has 50 in-air FSF comparisons for the ten new energies in which the calculated FSFs were obtained from the interpolated fluence parameters. The second box has 55 FSF comparisons for different energies and depths in water. The third box has 66 absolute dose comparisons between the calculations from the Eclipse TPS and the measurements for various ranges, SOBP widths, and field sizes
