
Fig. 2.
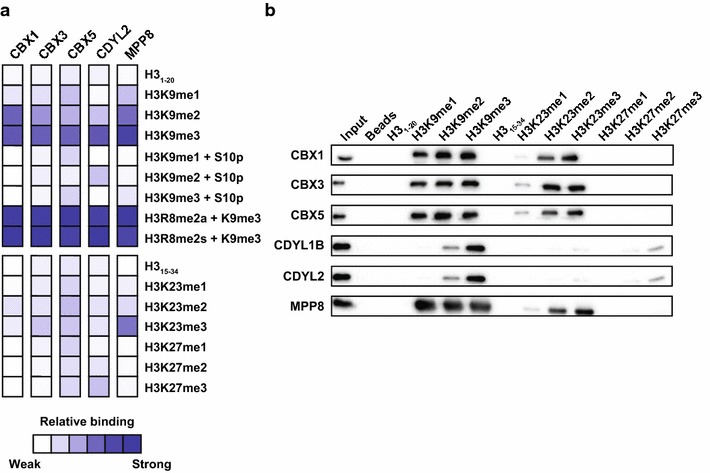
Chromodomains interact with H3K23me2/3 in addition to H3K9me1/2/3. a Heat map showing the relative binding detected for each of the indicated domains on the peptide microarray platform. Data represent the average of two independent arrays relative to the most intense binding signal within the indicated set of peptides. b Western blot results of peptide pull-downs performed with the indicated GST-tagged domain and histone peptide. The input is shown in Lane 1 and the bound fraction is shown in Lanes 2–13