Fig. 4.

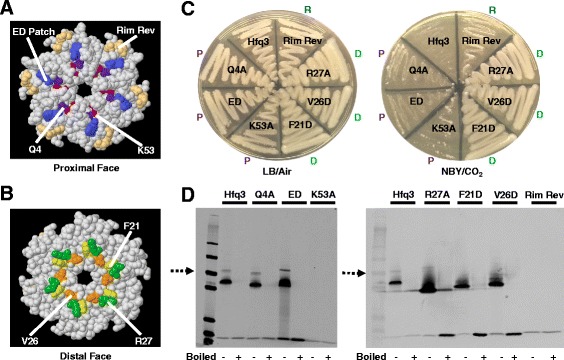
Mutational Analysis of Hfq3. a, b Jmol-generated images of the proximal and distal faces of E. coli Hfq (PDB 3QHS) with mutated residues highlighted and numbered using B. anthracis Hfq3 nomenclature. c Growth comparison of each Hfq3 mutant patched to LB incubated at 37 °C in air (left) or to NBY/bicarbonate incubated at 37 °C in 15% CO2 (right). Mutations are noted as “P” for proximal, “D” for distal, or “R” for rim along the edges of the plate. d Expression of each Hfq3 mutant grown under inducing conditions to an OD600 of 0.7–1.0. Note that the Hfq3 control was prepared as described in Fig. 2d. Equal amounts of total soluble protein from cell lysates were subjected to SDS-PAGE and western blotting with anti-Hfq3. Samples were analyzed under semi-native (-) and boiled (+) conditions. Dotted arrows represent the 50 kDa marker band
