Fig. 6.

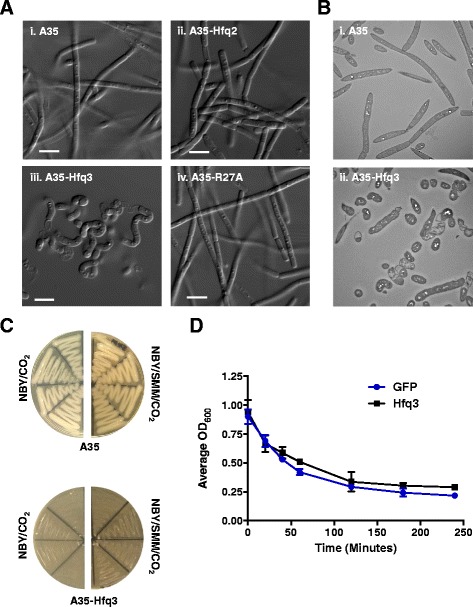
Hfq3 Strain Physiology. Samples for microscopy were prepared from LB plate scrapings for each strain. a Differential interference contrast (DIC) microscopy using 63x objective; scale bar 5 μm. (i) Ames 35 parent strain, (ii) Ames 35 overexpressing Hfq2, (iii) Ames 35 overexpressing Hfq3, and (iv) Ames 35 overexpressing Hfq3 distal face mutant R27A. b Transmission electron microscopy (TEM) of B. anthracis strains at 1500X. (i) Ames 35 parent strain and (ii) Ames 35 overexpressing Hfq3. c Growth comparison of Ames 35 parent strain (top) and Hfq3 overexpression strain (bottom) patched to NBY/bicarbonate incubated at 37 °C in 15% CO2 (left) and to NBY/bicarbonate supplemented with 0.5 M sucrose, 16.85 mM maleic acid, and 20 mM MgCl2 incubated at 37 °C in 15% CO2 (right). d Triton X-100 (0.05%)-induced cell autolysis of pSW4-GFP (blue circles) and pSW4-Hfq3 (black squares) overexpression strains. Error bars reflect standard error of the mean (SEM) of three biological replicates for each strain. Similar results were observed in two additional independent experiments
