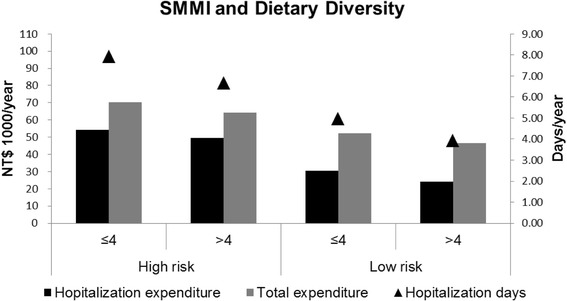
Fig. 2.

Annual adjusted mean hospitalization (days and expenditure) and total medical expenditure stratified by the SMMI and DDS (n = 1337). The models were adjusted for age (y), gender, region of residence, ethnicity, education level, living status, self-reported financial status, household income (NT$/mo), perceived health status, ADL, CCI, energy (kcal/d), protein (g/d), and physical activity (<1.5 MET/day or ≥ 1.5 MET/day)
