
Fig. 1.
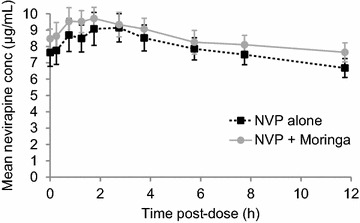
Mean nevirapine plasma concentration–time profile with and without moringa. The error bars represent the standard error of the mean
Official websites use .gov
A
.gov website belongs to an official
government organization in the United States.
Secure .gov websites use HTTPS
A lock (
) or https:// means you've safely
connected to the .gov website. Share sensitive
information only on official, secure websites.
Mean nevirapine plasma concentration–time profile with and without moringa. The error bars represent the standard error of the mean