Fig. 3.

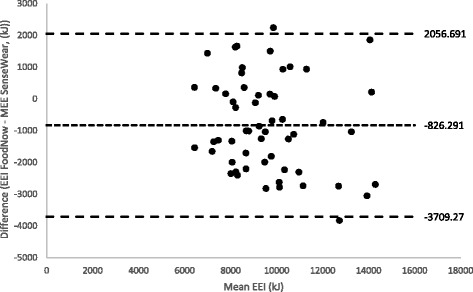
Bland-Altman plots between the mean estimated energy intake (EEI) and the difference in EEI and MEE in 56 young adults (n = 56). EEI: Estimated energy intake, MEE: Measured energy expenditure

Bland-Altman plots between the mean estimated energy intake (EEI) and the difference in EEI and MEE in 56 young adults (n = 56). EEI: Estimated energy intake, MEE: Measured energy expenditure