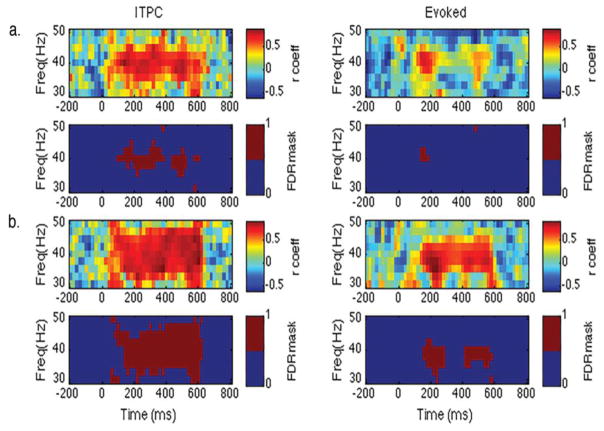
Fig. 4.
MEG data, between-session correlation results. Correlation results between sessions 1 and 2 for inter-trial phase coherence (ITPC) and evoked activity for right hemisphere white noise stimuli (a) and click train stimuli (b). In each plot, the first row shows the correlation coefficient (rcoeff) and the second row shows correlations that were significant following multiple comparison correction (FDR, q = .05; 0/blue = not significant, 1/red = significant). Left hemisphere results not illustrated to reduce redundancy.

