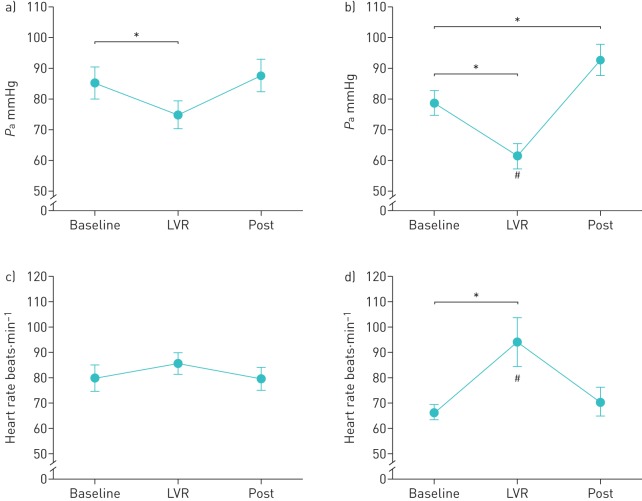
FIGURE 3.
Average mean arterial pressure (Pa) during lung volume recruitment (LVR) in (a) the respiratory muscle weakness (RMW) group and (b) the control group. Average heart rate during LVR in (c) the RMW group and (d) the control group. Data for each time point are presented as mean±sem. Baseline: 5 s prior to each LVR manoeuvre; LVR: the entire plateau phase of inflation; post: during the 5 s following each LVR manoeuvre. *: p<0.05 for RMW versus control subjects. #: p<0.05 relative to baseline.

