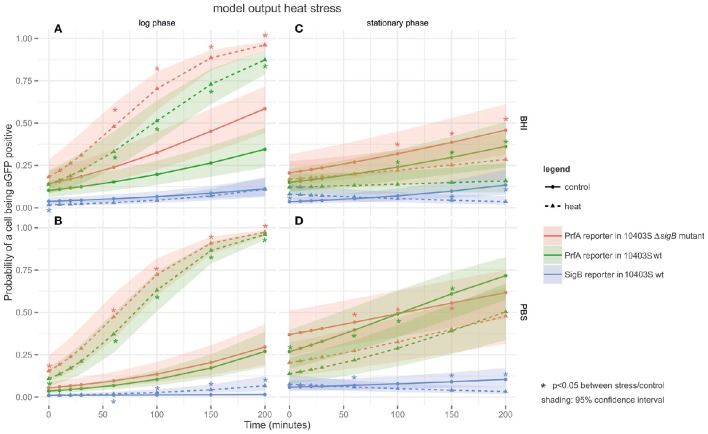
Figure 2.
Output of the linear model fitted to the heat FCM data. The panels are tiled to represent cultures grown to different growth phases in either BHI or PBS: (A) log phase cultures in BHI; (B) log phase cultures in PBS; (C) stationary phase cultures in BHI; and (D) stationary phase cultures in PBS. The y-axis represents the probability of a cell being eGFP-positive (as a result of active PrfA or σB), while the x-axis represents time in min. Three different strains are plotted on the graphs: the PrfA-reporter construct in a L. monocytogenes 10403S background, the PrfA-reporter construct in a L. monocytogenes 10403S ΔsigB mutant background, and the σB-reporter construct in a L. monocytogenes 10403S background. Dotted lines represent data collected under the stress condition (45°C heat), the solid line represents the control condition (37°C), the shading around each line represents the 95% confidence interval. *Are color coded to match the strain they pertain to and indicate a significant difference in the probability that a cell is eGFP positive in the stress condition vs. the control condition within one strain at one time point.

