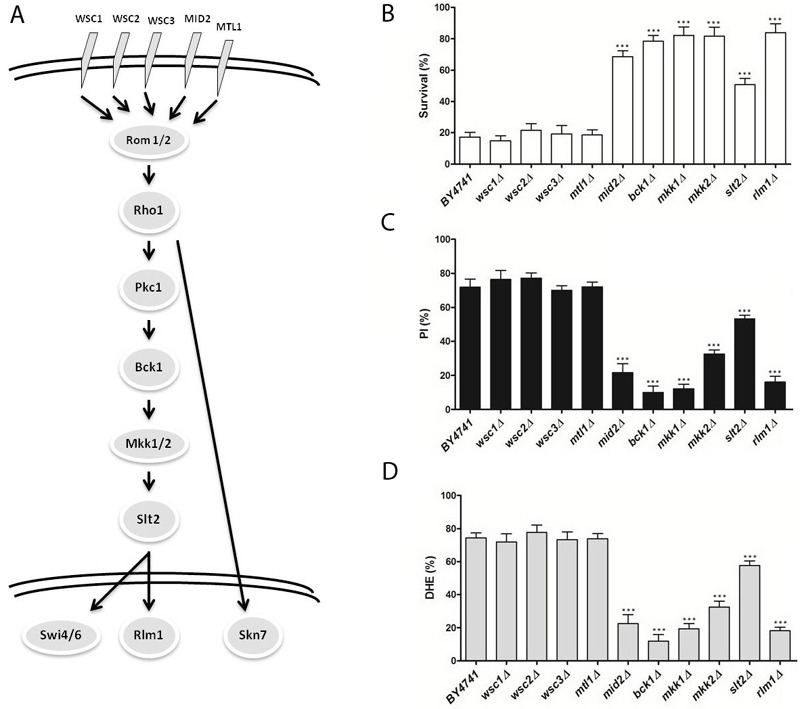
Figure 1. FIGURE 1: The role of the cell wall integrity (CWI) signaling pathway in acetic acid-induced apoptosis.

(A) Overview of the pathway.
(B) Survival of the wild type (BY4741) and indicated isogenic yeast strains exposed to 110 mM acetic acid, at pH 3.0 for 200 min. Values represent means ± SD of at least three independent experiments.
(C) Percentage of cells displaying propidium iodide (PI) internalization assessed by flow cytometry after treatment with 110 mM acetic acid, at pH 3.0 for 200 min.
(D) Percentage of intracellular ROS levels assessed by flow cytometry after treatment with 110 mM acetic acid, at pH 3.0 for 200 min. Values in (C) and (D) are represented as means ± SD of at least three independent experiments with at least 20000 cells counted in each time point. Asterisks represent significant statistical difference from control by One-way ANOVA test: (* represents p < 0.05 and *** p < 0.001).
