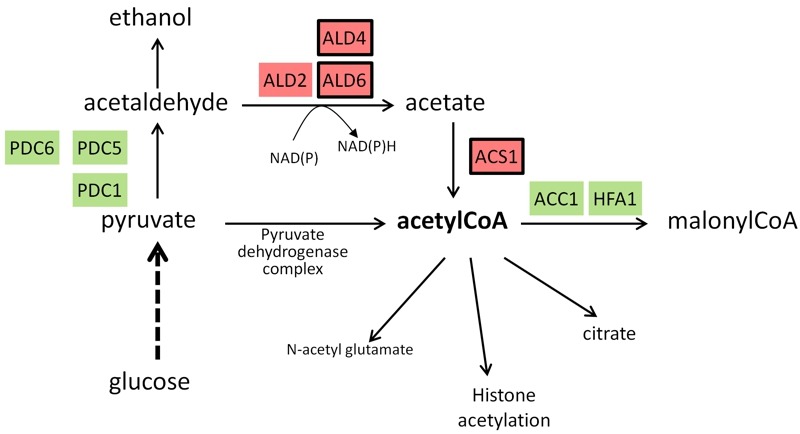
Figure 2. FIGURE 2: Schematic depiction of reactions involved in generation and use of Acetyl CoA.

Genes induced in response to alkaline pH stress are in red background whereas those repressed are in green background. Expression profiles have been collected from published transcriptomic data 14,18,22,56,68,97. Genes whose expression has been found to be dependent of Snf1 according to 56 are framed.
