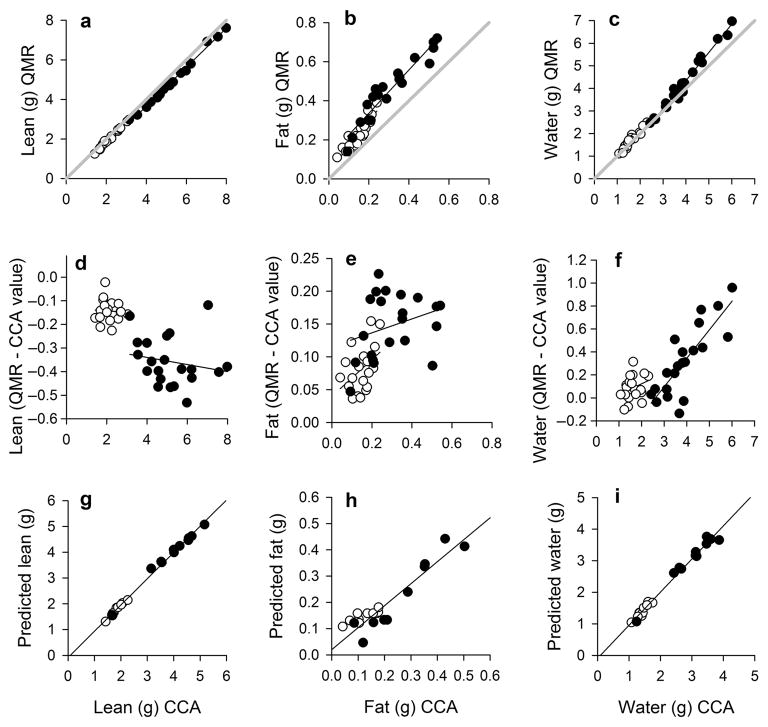
Figure 1.
Accuracy of quantitative magnetic resonance (QMR) at estimating body composition of brown anoles (Anolis sagrei). Relationship between QMR values and values from a chemical carcass analysis (CCA) for (a) lean mass, (b) fat mass, and (c) water mass. The gray line represents slope = 1. Regressions for the difference in QMR and CCA values for (d) lean mass, (e) fat mass, and (f) water mass. Results from the cross-validation procedure using predicted estimates of (g) lean mass, (h) fat mass, and (i) water mass from regression equations in Table 1 (see text for details). Females are represented by open circles, and males are represented by closed circles. Statistics are reported in Table 1. Although CCA values are on the x-axis (which is the convention in the literature), this variable was the dependent variable in the statistical analyses.

