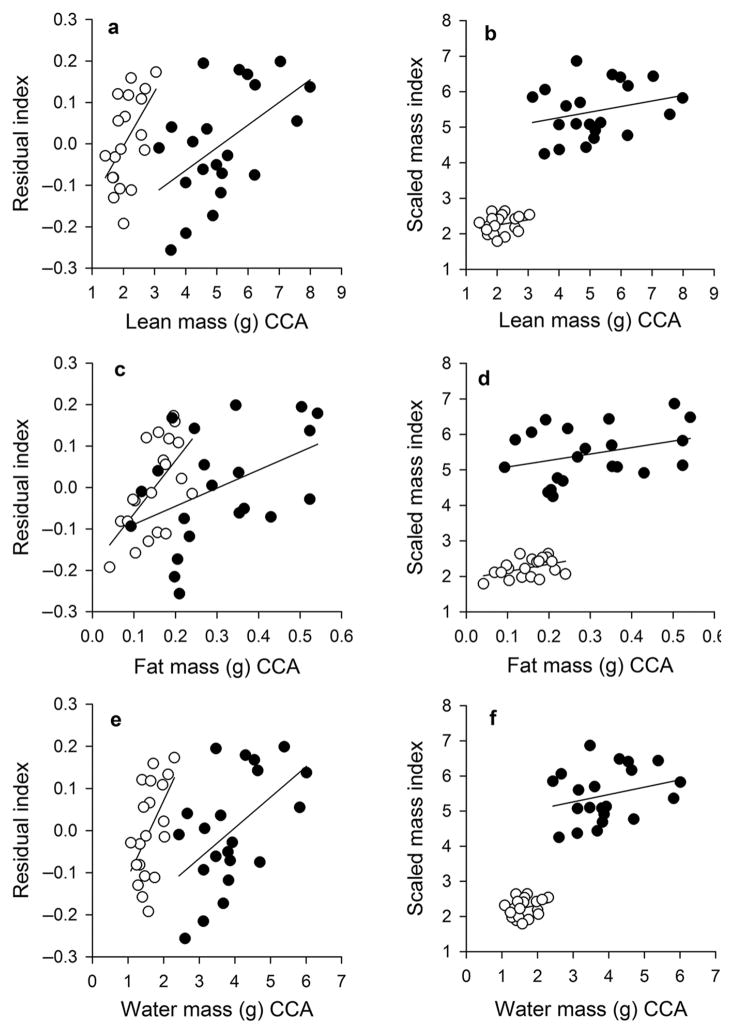
Figure 3.
Linear relationships between two body condition indices and lean mass (a and b), fat mass (c and d), and water mass (e and f) in the brown anole (Anolis sagrei). Body composition values are based on results from the chemical carcass analyses (CCA). Graphs in the left column show relationship with the residual index of body condition, and graphs in the right column show relationships with the scaled mass index of body condition. Males are represented by solid circles and females by open circles. Statistics are reported in Table 3.

