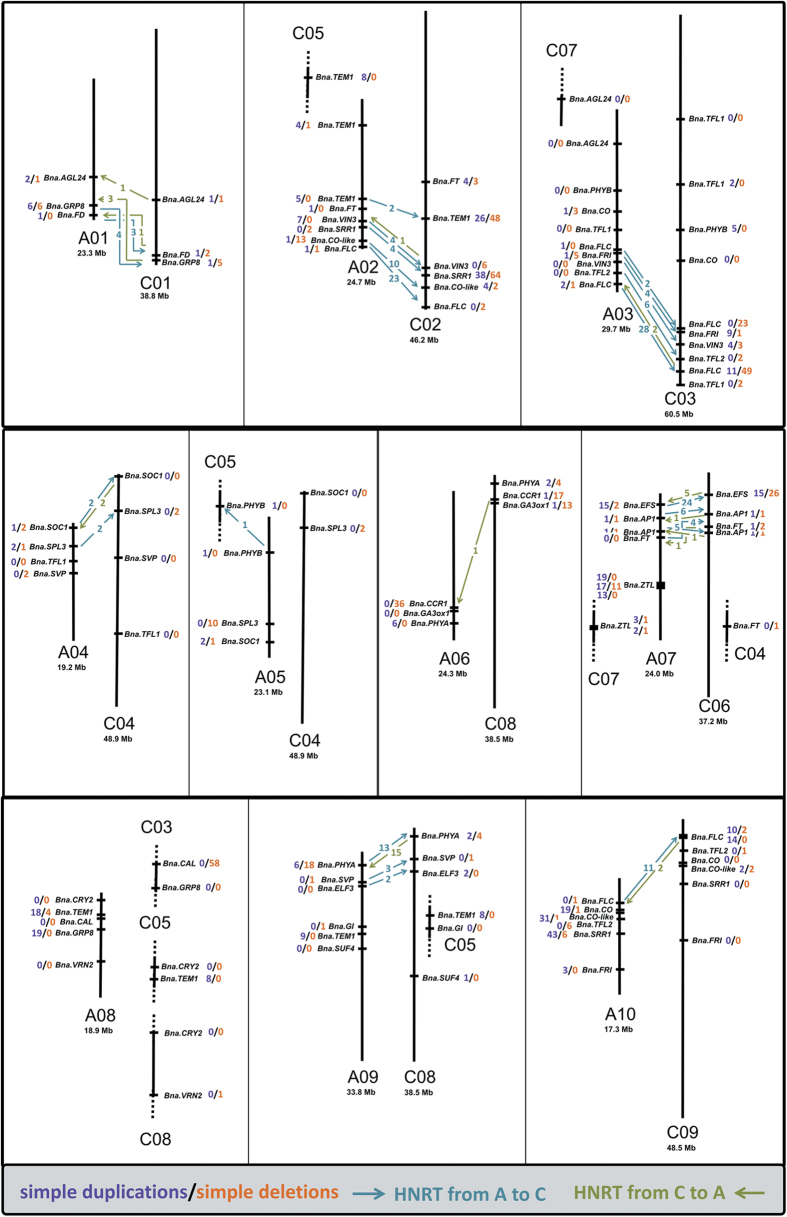
Figure 3. Landscape of homeologous target gene copies (excluding copies on x_random chromosomes).
Chromosomes are shown as black vertical lines. Partial chromosomes are indicated by dotted lines at their ends. For chromosomes shown in full length, the total length is given below the chromosome name. Genetic positions are relative approximations. Arrows indicate HNRTs between homeologous copies, either from A-subgenome to C-subgenome homeologs (blue) or from C-subgenome to A-subgenome homeologs (green). The numbers behind the gene names indicate the number of simple duplication or deletion events (not involved in HNRTs) in purple and orange, respectively.

