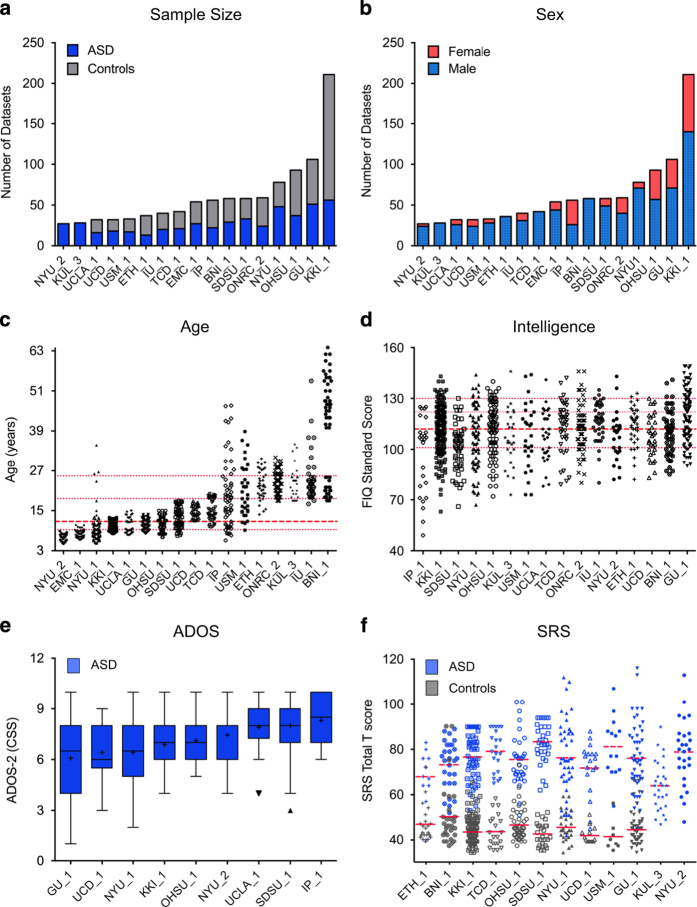
Figure 1. Key phenotypic characteristics.
(a) Total number of datasets per group (gray=controls; blue=autism spectrum disorder (ASD)) for the 17 cross-sectional ABIDE II data collections (i.e., collections from individuals not included in ABIDE I). Data are ordered as a function of sample size. (b) Number of males (light blue) and females (red) for each data collection, irrespective of diagnostic group. Data are ordered as a function of sample size. (c) Age at time of scan in years per collection (ordered by mean age per collection), irrespective of diagnostic group. The median age across collections (11.7 years) is depicted with a thick red dashed line; 25th, 75th, and 90th percentiles (9.3, 18.6, and 25.5 years, respectively) are represented by thin red dashed lines. (d) Distribution of full scale IQ (FIQ) standard scores per collection (ordered by lowest FIQ included per collection) for all datasets, irrespective of diagnostic group. The median FIQ across collections (112) is depicted with a thick red dashed line; 25th, 75th, and 90th percentiles (101, 122, and 130, respectively) are represented by thin red dashed lines. (e) Tukey’s box-whiskers plots depict the distribution of Autism Diagnostic Observation Schedule, Second Edition (ADOS-2) total calibrated severity scores (CSS) for ASD datasets in the nine collections sharing them (ordered by mean CSS per collection). The black plus sign depicts the mean CSS for each collection. (f) Distribution of Social Responsiveness Scale (SRS) total T scores (gray=controls; blue=ASD) in the 12 collections sharing them. For each collection, red dashed and solid lines indicate mean SRS total T scores of ASD and controls, respectively.

