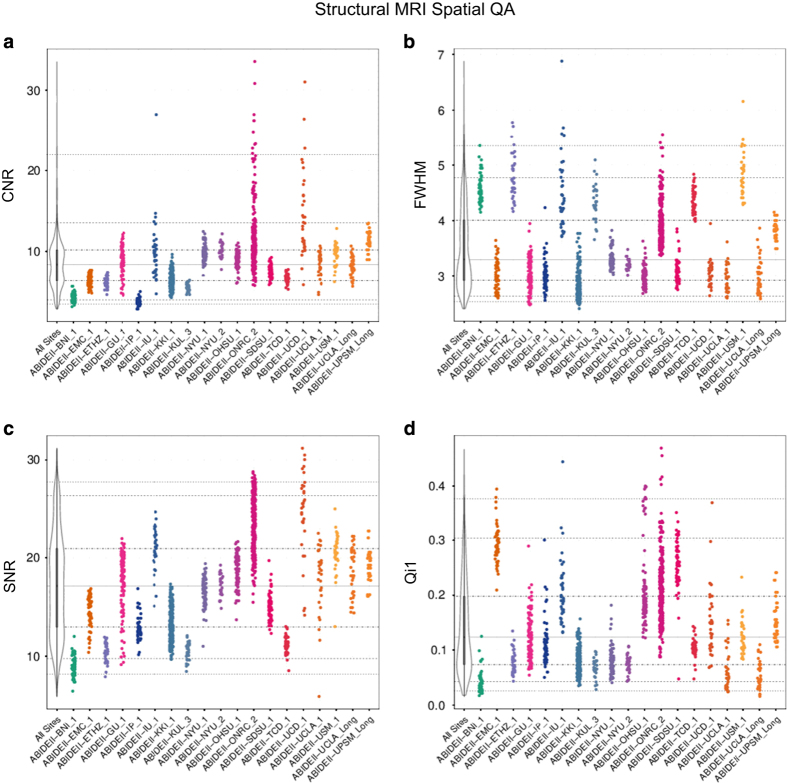
Figure 3. Selection of spatial quality assurance (QA) metrics for high resolution MRI datasets.
(a) Contrast-to-noise ratio (CNR) 50 , (b) smoothness of voxels indexed as full half-width maximum (FHWM) 62 , (c) signal-to-noise ratio (SNR) 50 , (d) artifactual voxel detection (Qi1) 51 - See Table 5 for details on this and the other quality metrics released. The colored scatterplots illustrate the quality metrics distribution for spatial MRI dataset within a given ADBIE II collection (17 cross-sectional and 2 longitudinal collections). The black and white violin plots represent a kernel density estimation of the distribution across all datasets for each quality metrics. The midline thick gray line represents the value that occurs most commonly in the distribution. For each plot the horizontal gray lines mark the 1st, 5th, 25th, 50th (solid gray line), 75th, 95th and 99th percentiles starting from the bottom.

