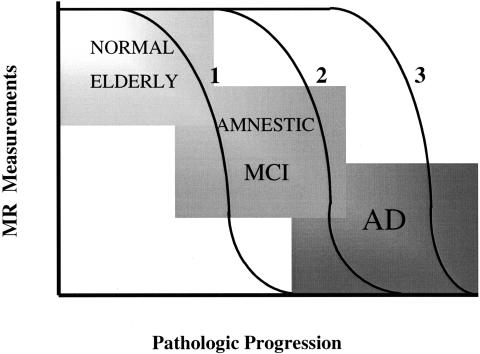
FIG. 2.
Regional structural markers for disease progression may vary with the pathologic stages of AD. This hypothetical graph represents the regional structural MR measurement change at different stages of disease progression. Regional measurements such as hippocampal atrophy rates (1) may be fastest early in the earliest pathologic stages, and may slow down later in the disease. Temporal lobe atrophy rates (2) may be fastest later during the intermediate or the MCI stage, and frontal lobe atrophy rates (3) may be fastest in clinically established AD. The choice of MR-based regional measurements should be tailored based on the severity of the disease.

