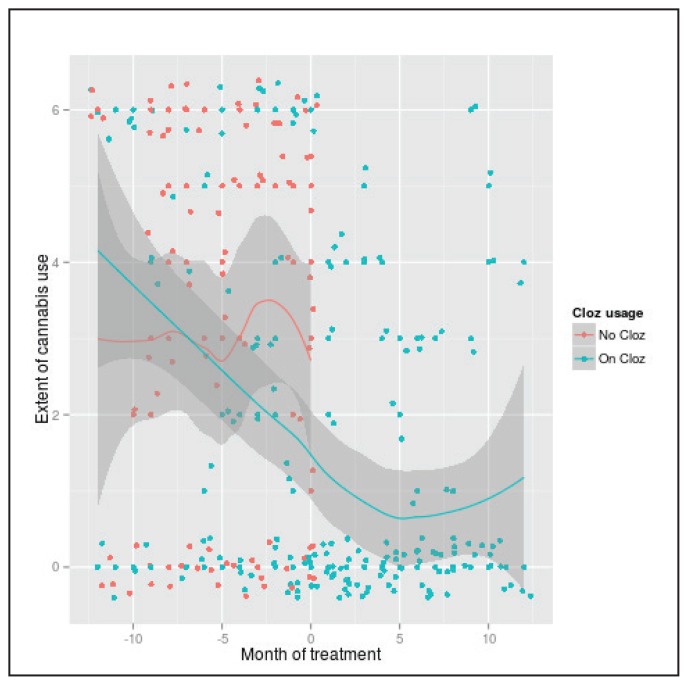
Figure 1.
Degree of cannabis use in an outpatient setting, as a function of time and clozapine exposure.
Data points were “jittered” to show as distinct points on the plot. Jittering was used to better visualize how many data points are positioned on one value depicted in the graph; the true value of data points is one of 0–6. Frequency of use was coded as 0 = zero use; 1= less than once a month; 2 = once per month; 3 = two to three times per month; 4 = once to twice a week; 5 = three to four times per week; 6 = greater than five times a week.

