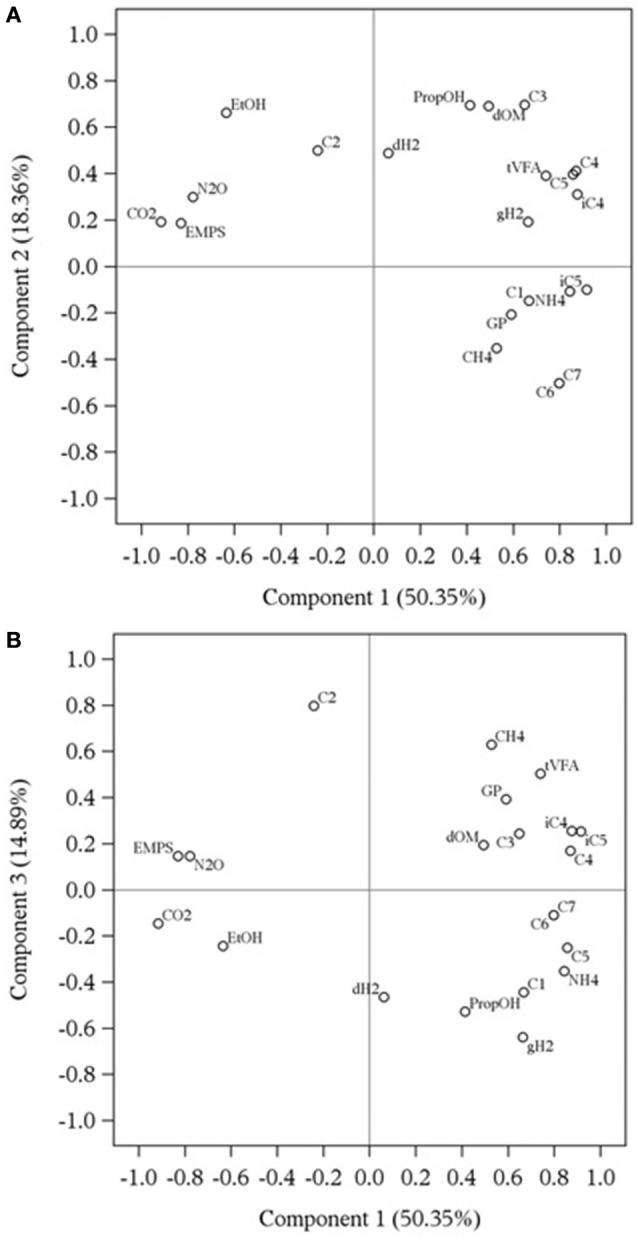
Figure 1.

Component pattern plots obtained by principal component analysis describing the relationship among rumen fermentation variables affected by methanogenesis inhibitors using a rumen simulation technique, along components 1 and 2 (A) and components 1 and 3 (B). dH2: dissolved hydrogen (μM); GP, total gas production (mL/d); CH4, methane (%); gH2, gaseous hydrogen (%); CO2, carbon dioxide (%); N2O, nitrous oxide (%); dOM, organic matter disappearance (%); EMPS, efficiency of microbial protein synthesis (g microbial N/kg organic matter fermented); tVFA, total volatile fatty acid concentration (mM); C1, formate (mM); C2, acetate (mM); C3, propionate (mM); iC4, isobutyrate (mM); C4, butyrate (mM); C5, valerate (mM); iC5, isovalerate (mM); C6, caproate (mM); C7, heptanoate (mM); EtOH, ethanol (mM); NH4, ammonium (mM); PropOH, propanol (mM). Gas percentages are based on the sum of CH4, H2, CO2, and N2O produced.
