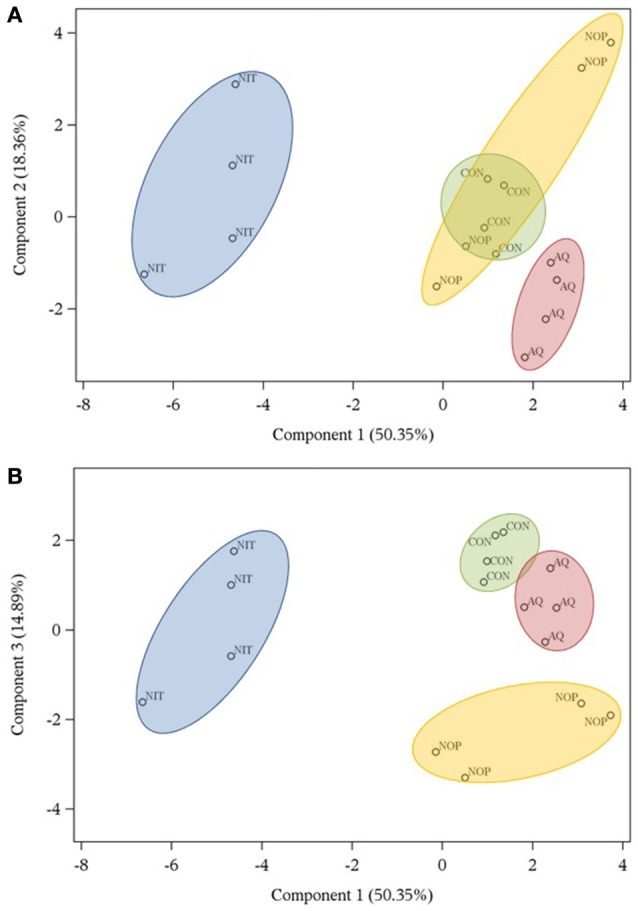
Figure 2.

Score plots obtained by principal component analysis describing the distribution of treatments (control, CON; nitrate, NIT; 3-nitrooxypropanol, NOP; anthraquinone, AQ) tested with a rumen simulation technique along components 1 and 2 (A) and components 1 and 3 (B).
