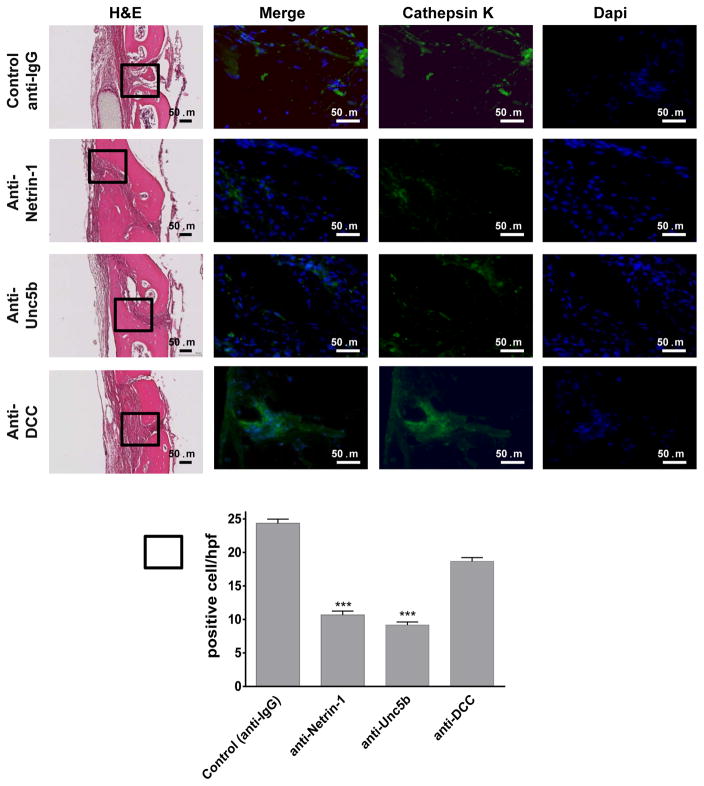
Figure 3. Immunohistochemistry for markers of osteoclasts.
Calvaria were processed and immunohistologic staining carried out. Shown are representative H&E sections of calvariae (from n=5 mice per group) stained for Cathepsin K (green). Nuclei are shown in blue (Dapi). Quantification of the number of positive cellst/hpf was done. Data are means±SEM (n=5 mice per group). All images were taken at the same magnification 200X and 400X. Scale bar indicates 50 μm. ***p<0.001 (ANOVA).

