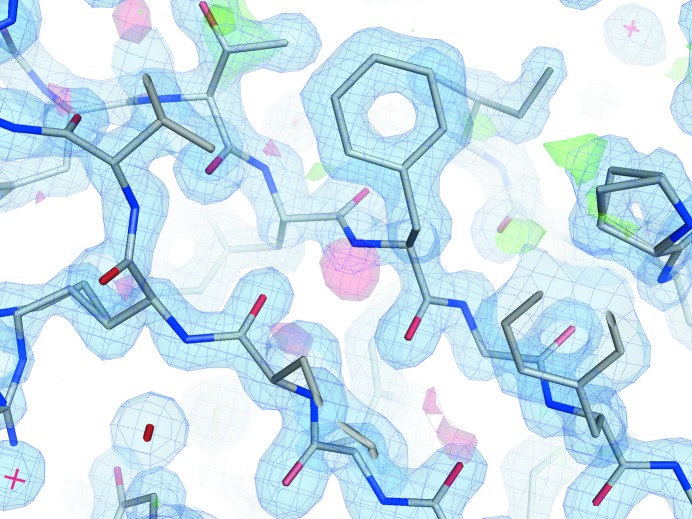
Figure 3.
Electron-density maps around β-sheet 2 of CagXct monomer A. The 2F o − F c map (blue) is contoured at 1.4σ and the F o − F c map is contoured at 3.0σ (green) and −3.0σ (red). The difference density ripples (red and green) are likely to be owing to crystal twinning. This figure was prepared using PyMOL (Schrödinger).

