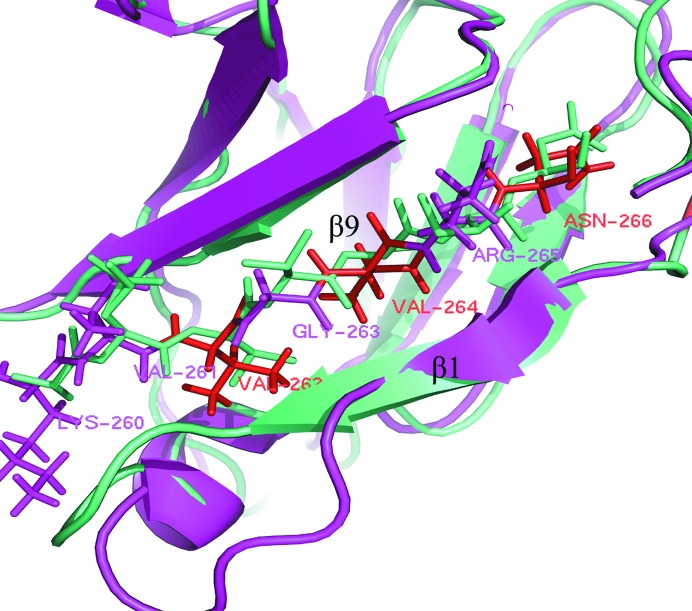
Figure 7.
Comparison of the protein-binding region of the β9 strand (shown as sticks; β1 strands are shown as cartoons) in CagXct (cyan) and in TraO (magenta, only the residues of TraO are labelled). Apart from the binding residues, there is a high sequence-similarity pattern: ‘xVxVxN’ (these residues are shown in red; x represents the binding amino-acid residues).

