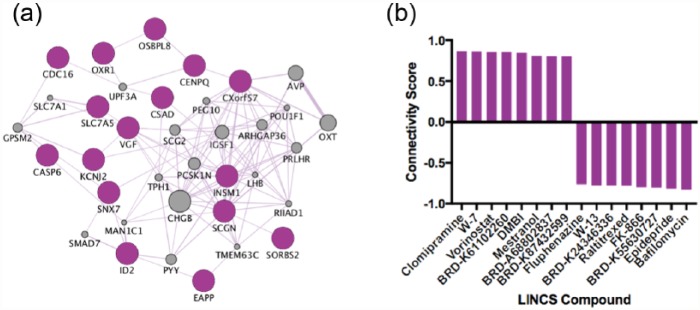
Figure 3.
(a) Our antidepressant mRNA signature visualised as a gene co-expression network. Genes in grey represent hypothetical transcripts connecting other genes within the network, whereas genes in purple represent those transcripts identified from our dataset. (b) Eight compounds with the strongest positive connectivity scores (similar effects on mRNA) and eight compounds with the strongest negative connectivity scores (opposite effects on mRNA) in neural progenitor cells.

