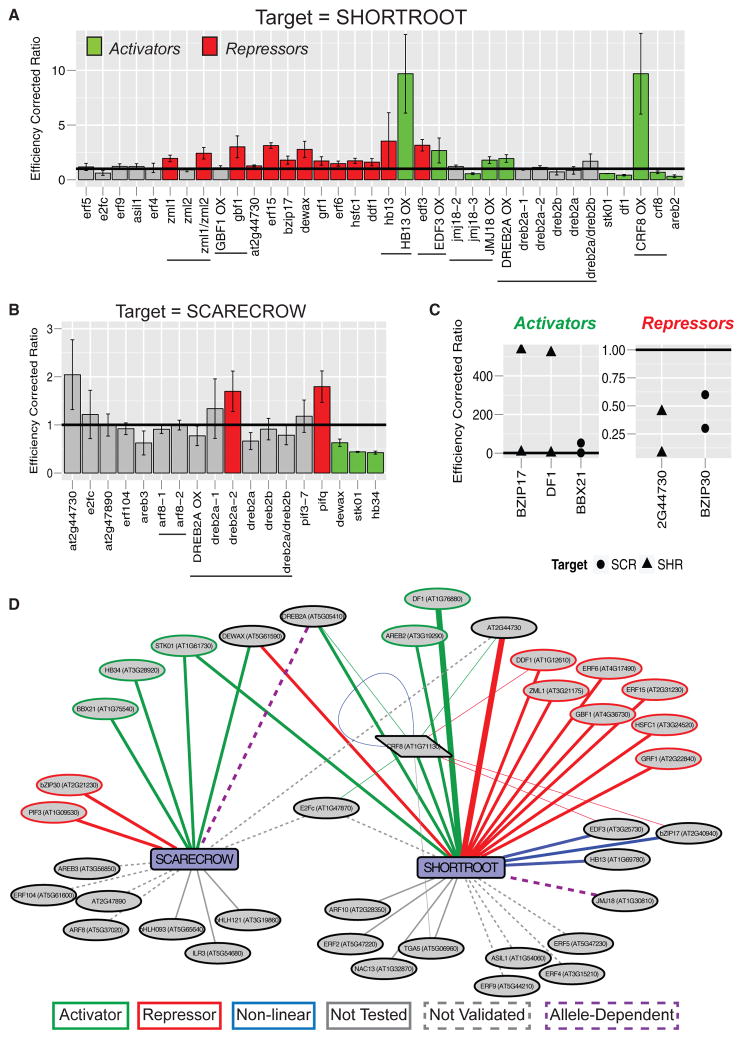
Figure 4. Subnetwork Validation In Planta Reveals Complex and Combinatorial Control of SHORTROOT and SCARECROW Expression.
(A and B) Subnetworks were validated by obtaining mutants or overexpression lines of upstream TFs and assaying whole-root RNA for changes in (A) SHR or (B) SCR expression. Colored bars indicate assays achieving statistical significance (t test, p < 0.05) along with the inferred relationship (red, repressor; green, activator). Expression values were normalized by primer efficiency and ecotype control, represented by the horizontal bar at 1. Error bars represent the standard deviation between biological replicates. Horizontal lines under the graph indicate multiple alleles of the same gene. Capitalized gene names followed by OX indicate an overexpression allele, whereas lowercase gene names indicate a mutant allele.
(C) Additional validation was achieved by transient inducible overexpression of upstream TFs in root protoplasts. Protoplasts with TFs fused to the glucocorticoid receptor (35S:TF-GR) were subjected to a 4-hr induction with dexamethasone prior to analysis. Five TFs that bound SHR (triangles) or SCR (circles) were analyzed. Three activate (left panel) and two repress (right panel) the expression of their target.
(D) Network summary of validated interactions from in planta assays. Green lines indicate activating TFs and red lines indicate repressing TFs. Blue lines indicate non-linear relationships. Purple dotted lines indicate allele-dependent results. Solid gray lines represent untested relationships, and dotted gray lines indicate relationships that were tested but not validated. Thick edges demonstrate validation by both assays. Thin edges are validation for the regulators upstream of CRF8.
See also Table S4.

