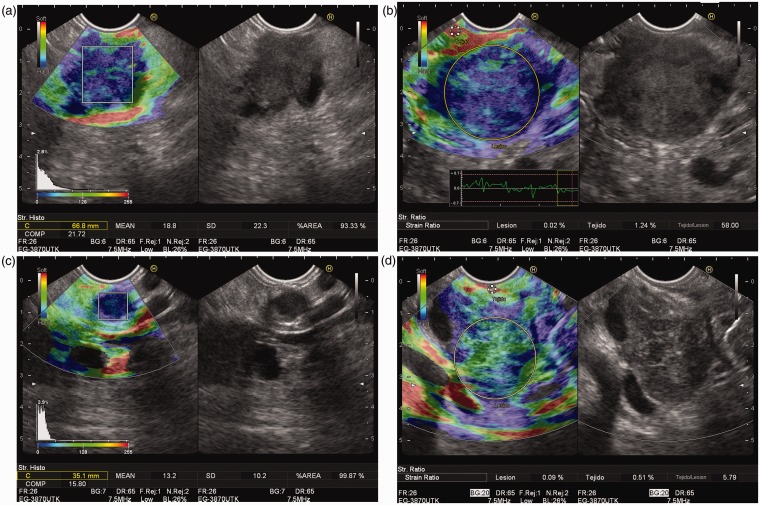
Figure 3.
Endoscopic ultrasound guided elastographic images of different pancreatic solid tumors. (a) Pancreatic adenocarcinoma, with a predominant blue pattern in qualitative image, with a mean in the strain histogram of 18.8. (b) Pancreatic adenocarcinoma, with a predominant blue pattern in qualitative image, with a strain ratio of 58.00. (c) Solid pancreatic tumor, corresponding to a neuroendocrine lesion, with a blue pattern in qualitative image, and a strain histogram of 13.2. (d) Inflammatory mass located at pancreatic head, showing a heterogeneous green predominant pattern in qualitative image, and a strain ratio of 5.79.

