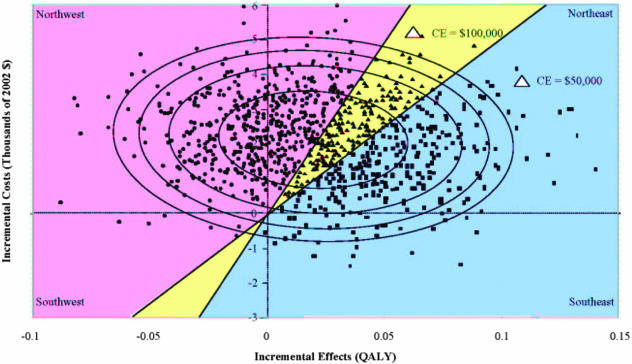
FIG. 2.
Incremental cost-effectiveness and confidence ellipses. The point estimate for the incremental cost-effectiveness ratio is highlighted as a magnified star. 50, 80, 90, and 95% confidence ellipses are superimposed on the distribution of 1000 bootstrapped data points. Bootstrapped distributions of the estimates can be used to determine the probability that the true value of the cost-effectiveness ratio lies within each of the regions of cost-effectiveness. The probability that the ratio is in the definitely adopt region is 0.298 (298 of 1000 points); the probability that the ratio falls in the ambiguously adopt region is 0.207 (207 of 1000 points); and the probability that the ratio is in the definitely do not adopt region is 0.495 (495 of 1000 points).

