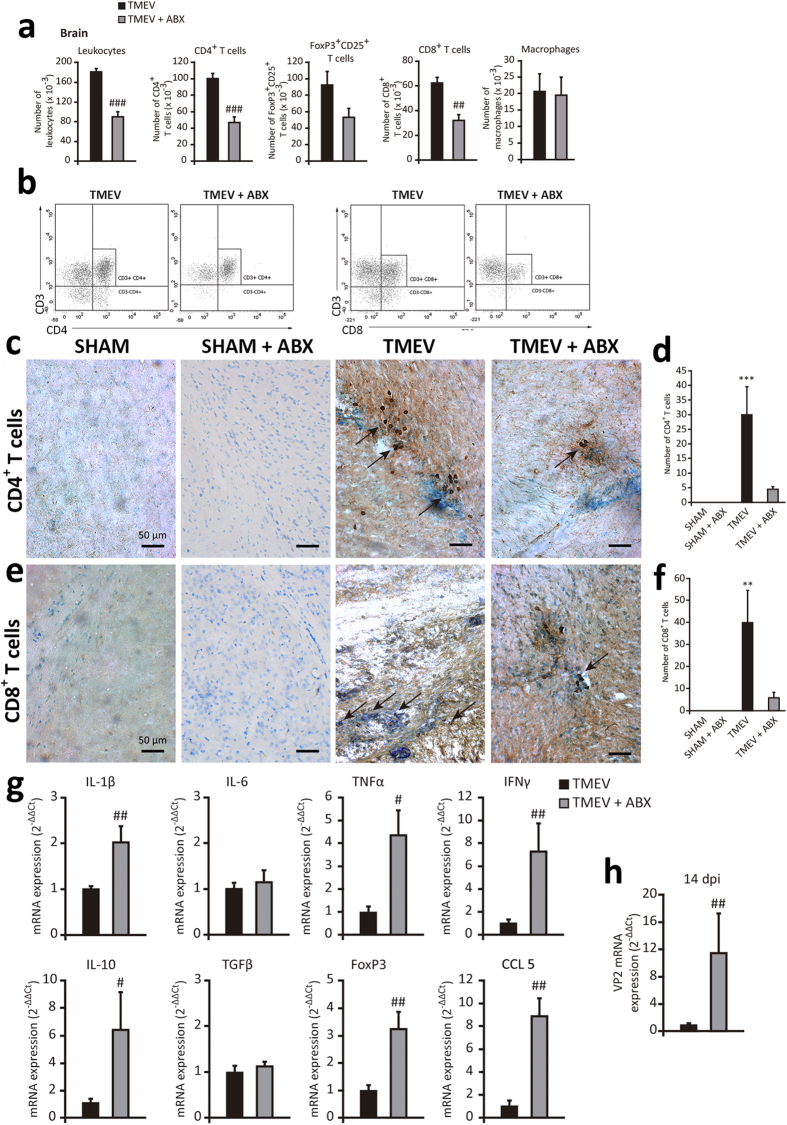
Figure 5. ABX treatment affects cell infiltrates into the brain parenchyma, and cytokine and chemokine expression.
A group of mice were treated with ABX for 14 days previously and 14 days after TMEV-infection. Once ABX treatment cessation the brains were obtained. (a) FACS analysis of leukocytes, macrophages and CD4+, CD8+ and FoxP3CD25+ T cells. (b) Representative flow cytometry plots of CD4+ or CD8+ cells in gated CD3+cells from brains of TMEV or TMEV-ABX mice (n = 6 mice per experimental group). Coronal brain sections (30 μm) from each experimental group were stained for CD4+ (c) or CD8+ (e) T cells and counterstained with toluidine blue. Arrows indicates CD4 or CD8 positive T cells. (d,f) Quantification of number of CD4+ or CD8+ T cells. Two fields of cerebral cortex per section were analyzed from at least 4 sections for each animal (n = 4 mice per group). (g) qRT-PCR analysis of cytokine and chemokine (IL-1β, IL-6, IL-10, TNF-α, IFN-γ, TGF-β, CCL5) expression in brain tissue at 14 dpi. FoxP3 mRNA transcripts were also measured. (h) qRT-PCR of VP2 mRNA to analyze the viral load. (TMEV, n = 9; TMEV-ABX, n = 10). The data represent the mean ± SEM and they were analyzed with a Student’s t-test (a), non-parametric Kruskal-Wallis test (d, f) and Mann-Whitney U test (g,h); **p < 0.01 vs. sham: ***p < 0.001 vs sham, #p < 0.05 vs TMEV, ##p < 0.01 vs TMEV, ###p < 0.001 vs TMEV.

