Figure 3.
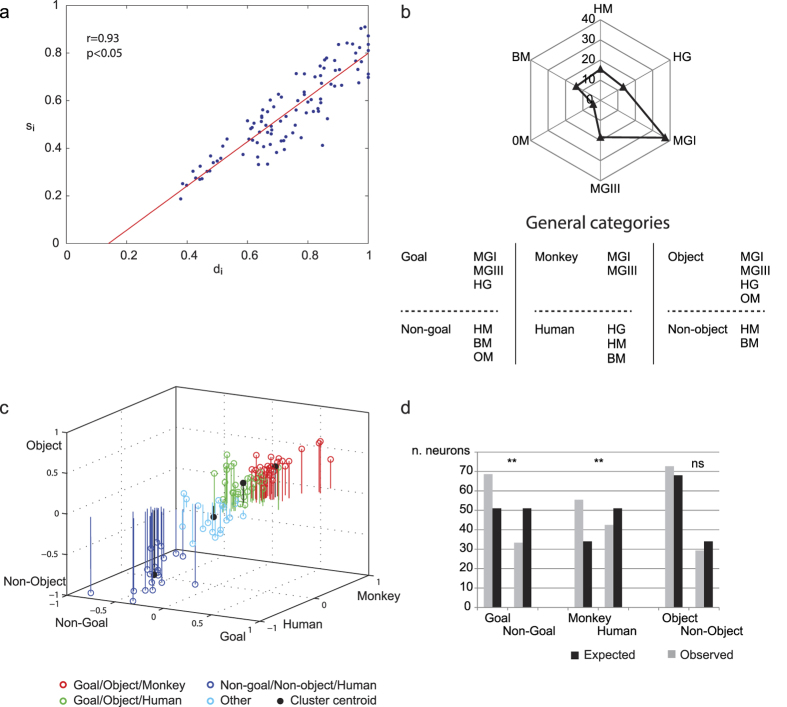
(a) Correlation between the Depth of tuning (di) and Selectivity (si) indexes. Each dot represents a neuron. (b) Top. Polar plot representing the number of neurons responding to each video stimulus. Each neuron is counted as 1 if it responds only to one stimulus, while when it responds to more than one stimulus, is counted as 1 divided by the number of effective stimuli. Bottom. Subdivision of the video stimuli in three pairs of general categories. (c) Plot of the normalized neural discharge according to the category indexes, represented in the three axes: Goal/Non-Goal; Monkey/Human; Object/Non-object. Values around zero on one axis correspond to low selectivity in that specific index. Colors indicate the four different clusters. (d) Histograms representing the expected and observed numbers of neurons belonging to the three pairs of general categories as defined in (b). Asterisks indicate a significant difference (p < 0.01) between expected and observed numbers.

