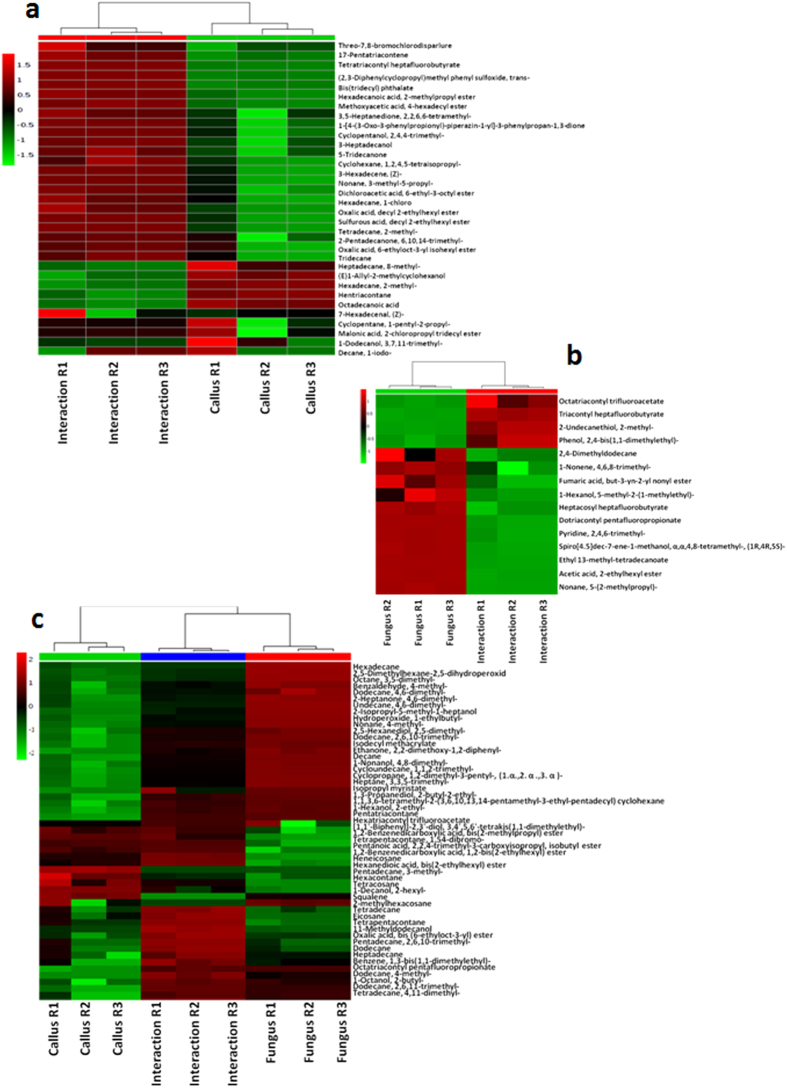
Figure 3. Heat map analysis of the metabolites of callus-fungus interactions.
Perturbations in levels of accumulation of the 33 compounds shared by profiles of callus and interaction (a), 15 compounds common to fungus and interaction (b) and 52 compounds shared by the profiles of callus, fungus and interaction (c) based on their relative peak area (%).

