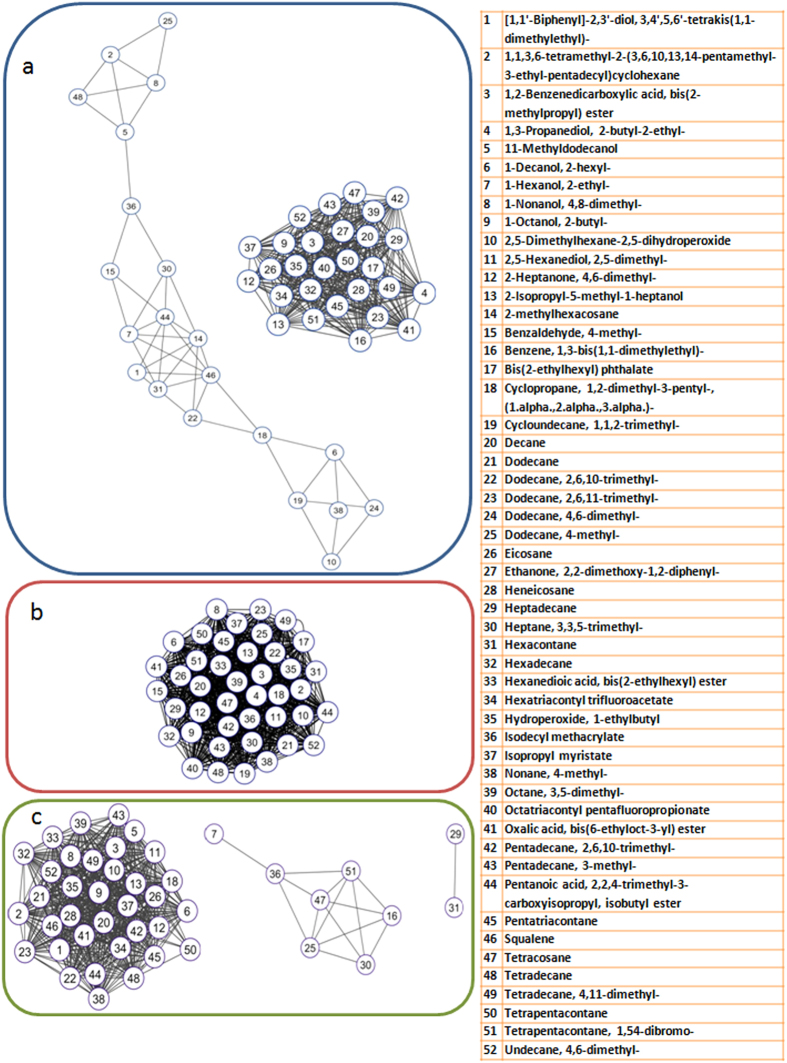
Figure 6. Correlation network analysis.
Network topology of the 52 compounds shared by the metabolite profiles of callus, fungus and interaction were different. In case of the fungus network (a) the 42 correlated compounds were clustered within a single network, whereas the callus network (b) comprised of two independent networks of which 49 compounds were correlated and the majority (28) were clustered in a dense plot. The rest (21) compounds were in a group of 3 smaller networks of 5, 6 and 10 nodes. In case of interaction network (c) a significantly different topology was observed. 44 compounds formed 3 independent networks, one being a dense cluster of 35 compounds while the other two comprised of 2 and 7 compounds respectively.

