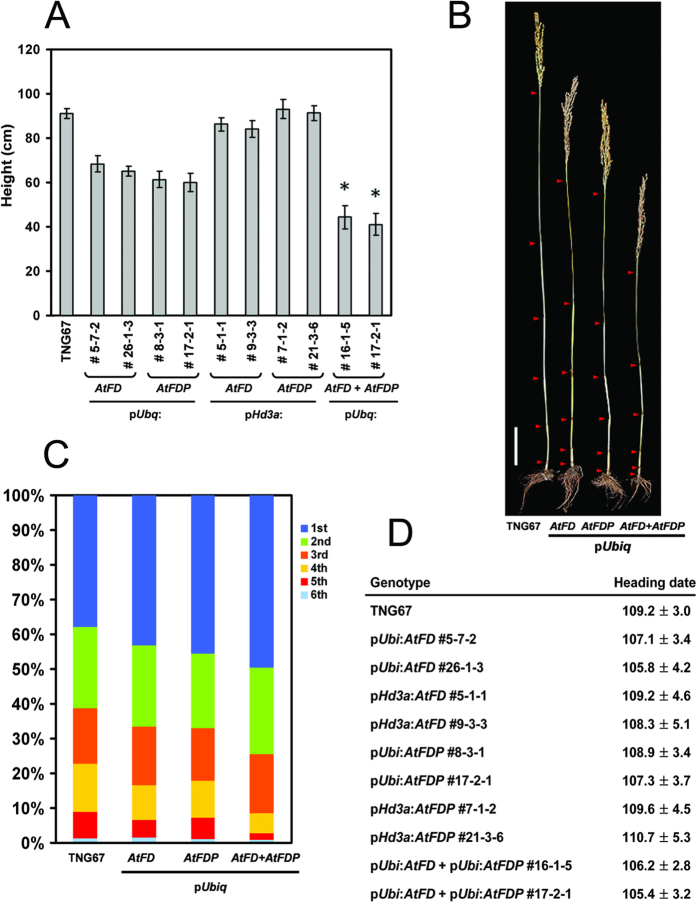
Figure 3. Characterization of transgenic rice plants.
(A) Measurement of plant height. Main culms of six to twelve plants per line were used for height measurement except panicle length. Values are means ± SD (n = 8–12, *P < 0.0001, Student’s t test). (B) Reduced plant height in transgenic rice plants. Arrowheads present each node. Scale bar = 10 cm (C) Proportion of each internode in transgenic rice plants. A representative plant from each line of pUbi:AtFD (#5-7-2), pUbi:AtFDP (#17-2-1) and pUbi:AtFD-pUbi:AtFDP (#16-1-5) was used together with TNG67. (D) Measurement of heading date from eight to twenty individual plants per line. Heading date is recorded based on number of days from sowing to the emergence of the first panicle. Values are means ± SD (n = 8–12).

