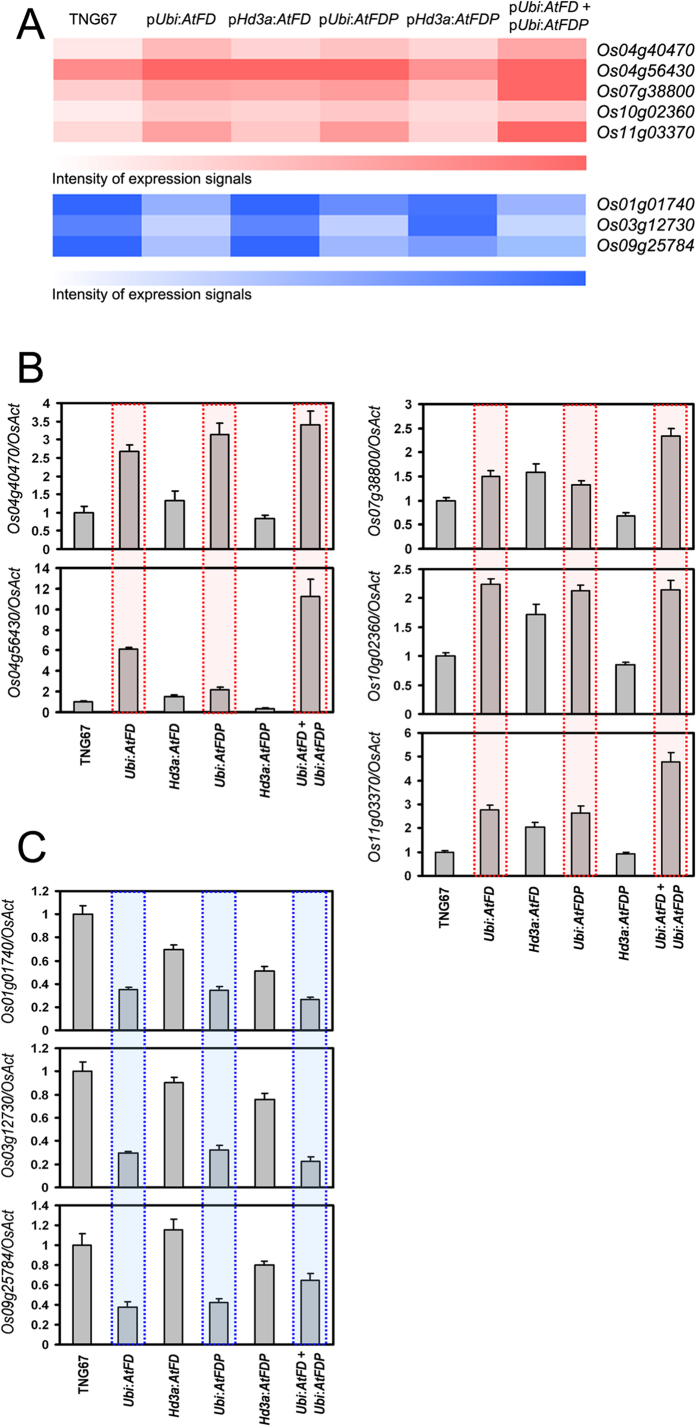
Figure 6. Confirmation of the expression patterns of candidate genes identified by microarray-based expression changes in the transgenic plants that showed phenotypes.
(A) A heat map showing expression level of candidate genes in each genotype through microarray hybridization. Red color and blue color represent up- and down-regulated candidate genes, respectively. Expression of candidates identified by microarray analyses as up-regulated genes (B) and down-regulated genes (C) in 50-day old plants of pUbi:AtFD, pUbi:AtFDP and pUbi:AtFD-pUbi:AtFDP double plants. Values are means ± SD of three PCR replicates.

