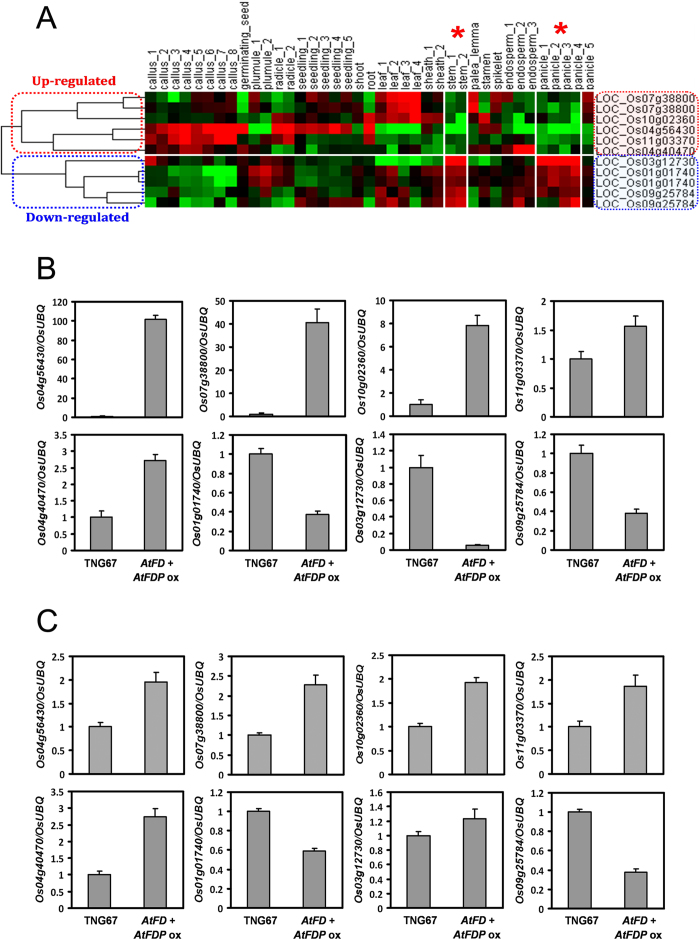
Figure 7. Generation of a heat map showing spatiotemporal expression and expression analyses of candidate genes in the stems and panicles.
(A) Up-regulated and down-regulated genes are differentially grouped into two clades. Expression of up-regulated genes in stems and panicles is low and that of down-regulated genes is high, in common. Red asterisks indicate stems and panicles. In the heat map, the red color represents an increase and the green color represents a decrease in gene expression, respectively. Verification of expression level of candidate genes in stems (B) and young panicles (C) between WT and AtFD-AtFDP dual overexpressors. Stem and panicle samples we used for expression analyses are matched with the stem_2 stage (heading stage) and panicle_4 stage (developing panicle with length between 40 and 50 mm), respectively in the heat map in (A). Values are means ± SD of three PCR replicates.

