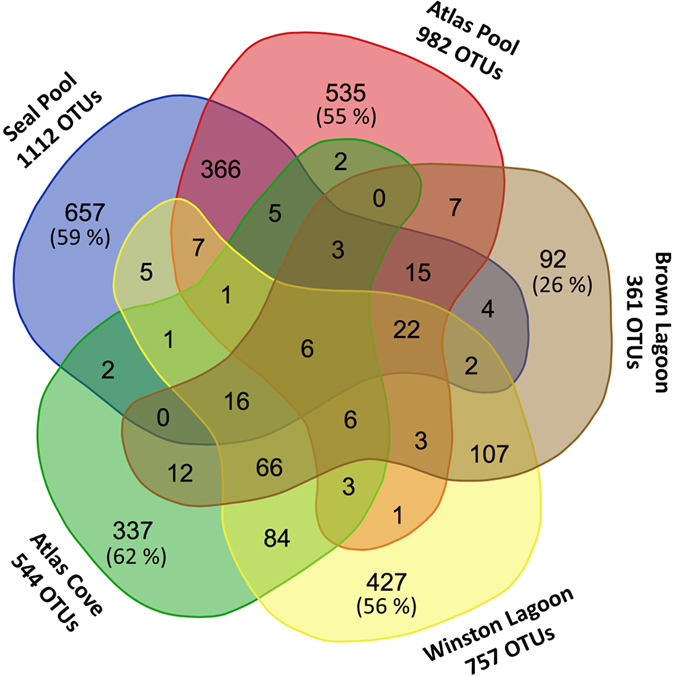
Figure 2. Venn diagram showing OTUs shared between the Heard Island sampling locations.

Total number of OTUs per site, percentage of non-shared OTUs at each location (outer lobe), and shared OTUs are shown. The six OTUs present in all locations were denovo1904, denovo179, denovo1428, denovo2631, denovo1094 and denovo1322. Image created using the Venn diagram tool at http://bioinformatics.psb.ugent.be/cgi-bin/liste/Venn/calculate_venn.htpl.
