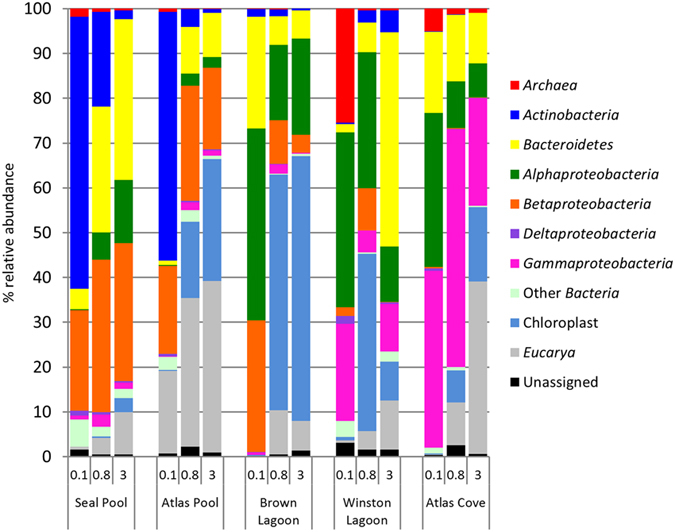
Figure 3. Relative abundance of the major microbial groups detected in Heard Island samples.

Samples are ordered by filter size (0.1 μm, 0.8 μm and 3.0 μm) and by increasing salinity from Seal Pool to Atlas Cove.

Samples are ordered by filter size (0.1 μm, 0.8 μm and 3.0 μm) and by increasing salinity from Seal Pool to Atlas Cove.