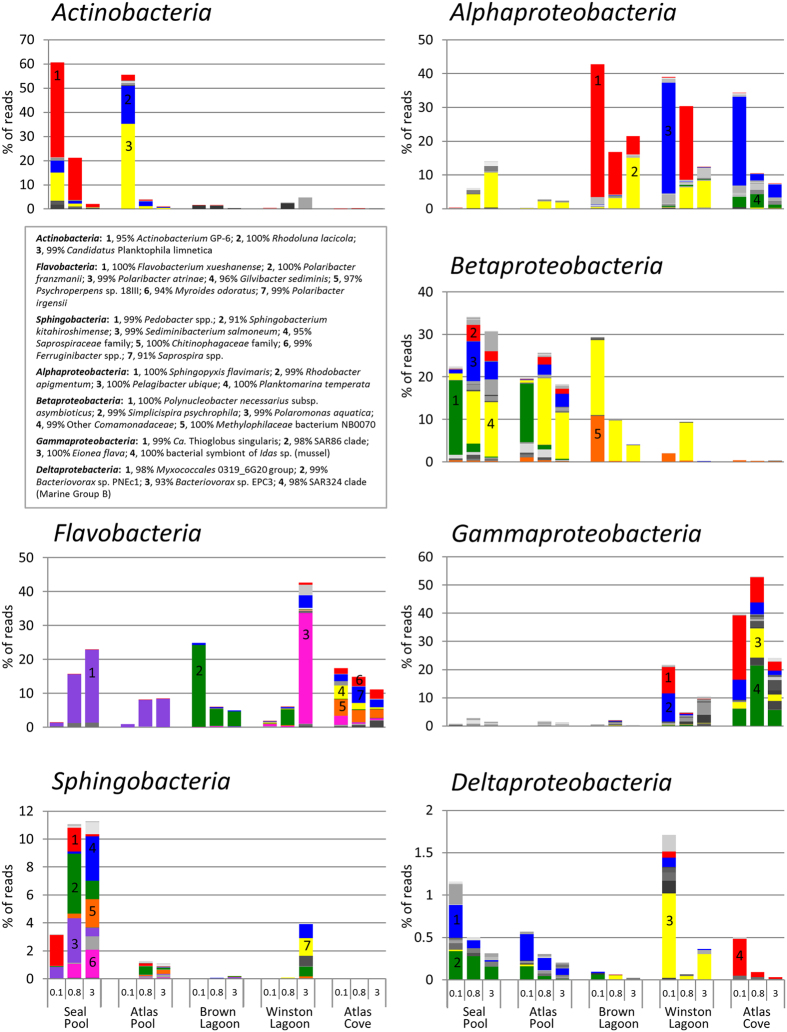
Figure 4. Relative abundance of OTUs for individual phyla of Bacteria.
Colours represent different OTUs at the level of 97% sequence identity. For selected dominant OTUs an indicative best BLAST match for the taxa is shown in the key, and percent identity has been rounded to a whole number. If the taxa could not be assigned to a genus, the next most specific grouping was reported. Full OTU data is provided in Table S4. The scales for relative abundance (% of reads) vary between panels. Samples are ordered by filter size and increasing salinity as for Fig. 3.

