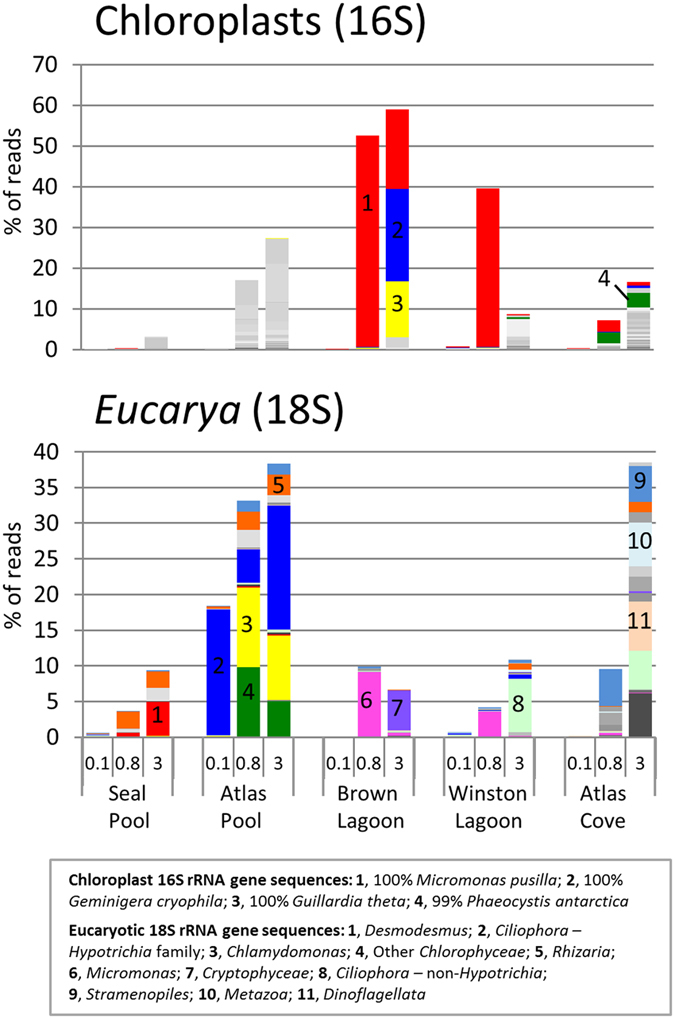
Figure 5. Relative abundance of OTUs for Eucarya.

For chloroplast sequences, selected dominant OTUs and their best BLAST match are shown in the key. For Eucarya detected as 18S rRNA gene sequences, OTUs are grouped at Order/Family level. Note comments about the colours, sequence identity, abundance scale, sample order and OTU table as for Fig. 4.
