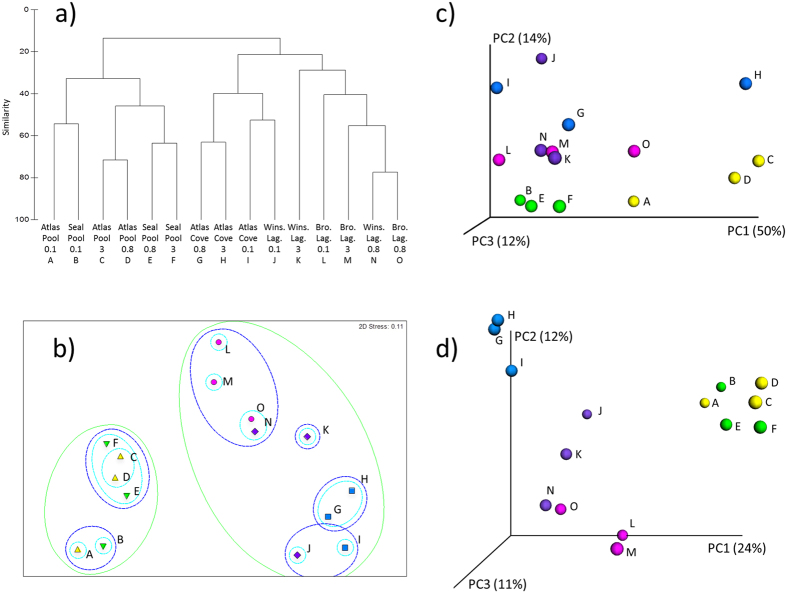
Figure 7. Clustering of Heard Island samples based on genus-level taxon abundance.
Taxon abundance data calculated as Bray-Curtis dissimilarity, normalised and square-root transformed. Samples which clustered together with 20%, 40% and 60% similarity in the dendrogram (a) are circled by green, blue and aqua ovals, respectively, in the nMDS plot (b). Clustering based on beta-diversity measured as weighted (c) and unweighted Unifrac principal coordinates analysis (d). For beta-diversity calculations, samples were rarefied to 5118 sequences. Samples are labelled A – O as per the dendrogram (a), with colour coding to indicate sampling location: Seal Pool (green), Atlas Pool (yellow), Brown Lagoon (pink), Winston Lagoon (purple) and Atlas Cove (blue).

