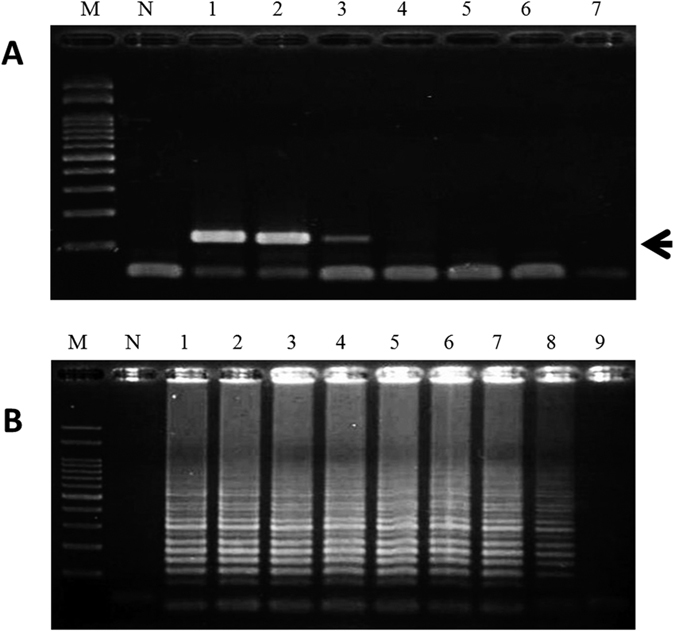
Figure 2.

The sensitivity of specific primers used in PCR (A) and LAMP (B) for the detection of garlic. Lanes M and N represent 100 bp of DNA ladder and the negative control, respectively. Lanes 1–9 represent the addition of different amounts of garlic DNA: 1, 102 ng; 2, 101 ng; 3, 100 ng; 4, 10−1 ng; 5, 10−2 ng; 6, 10−3 ng; 7, 10−4 ng; 8, 10−5 ng; and 9, 10−6 ng. Black arrow represents the amplified specific PCR product in the agarose gel.
