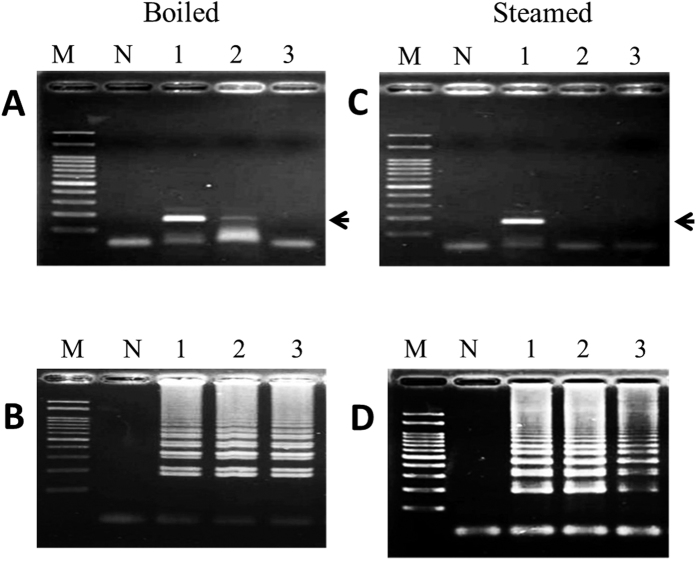
Figure 4.
Analysis of PCR (A,C) and LAMP (B,D) products derived from onion DNA after boiling for the indicated times. Lane M: 100 bp DNA ladder, Lane N: negative control, Lane 1: positive control (raw onion), Lanes 2–3: garlic was boiled for 60 and 80 min and steamed for 40 and 60 min, respectively. Black arrow represents the amplified specific PCR product in the agarose gel.

