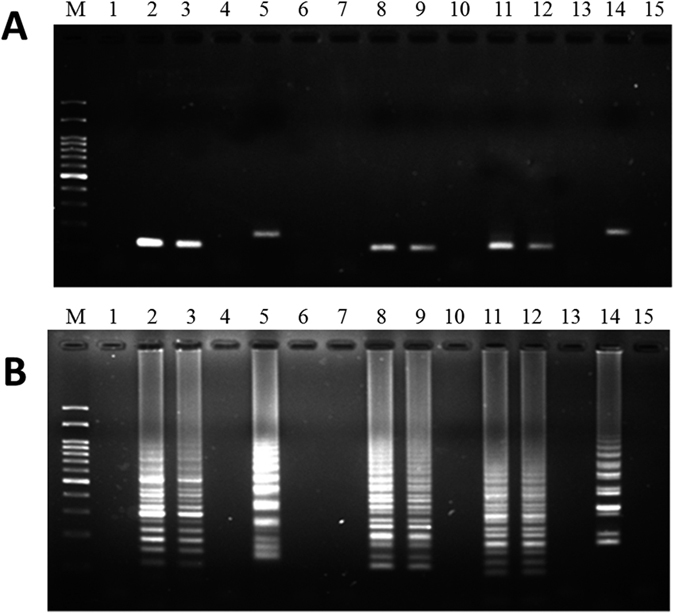
Figure 5.

Electrophoretic analysis of PCR (A) and LAMP (B) products from commercial shacha sauce products. Lane M represents 100 bp of DNA ladder. Lanes 1, 4, 7, 10 and 13 represent the negative controls used for garlic, Chinese leek, Chinese onion, green onion, and onion primers, respectively. Lanes 2, 5, 8, 11 and 14 represent the positive controls used for the five forbidden vegetable DNAs when garlic, Chinese leek, Chinese onion, green onion, and onion primers were added to the PCR and LAMP reactions, respectively. Lanes 3, 6, 9, 12 and 15 represent the DNA products amplified by PCR and LAMP when specific primers were used for the amplification of garlic, Chinese leek, Chinese onion, green onion, and onion DNAs.
