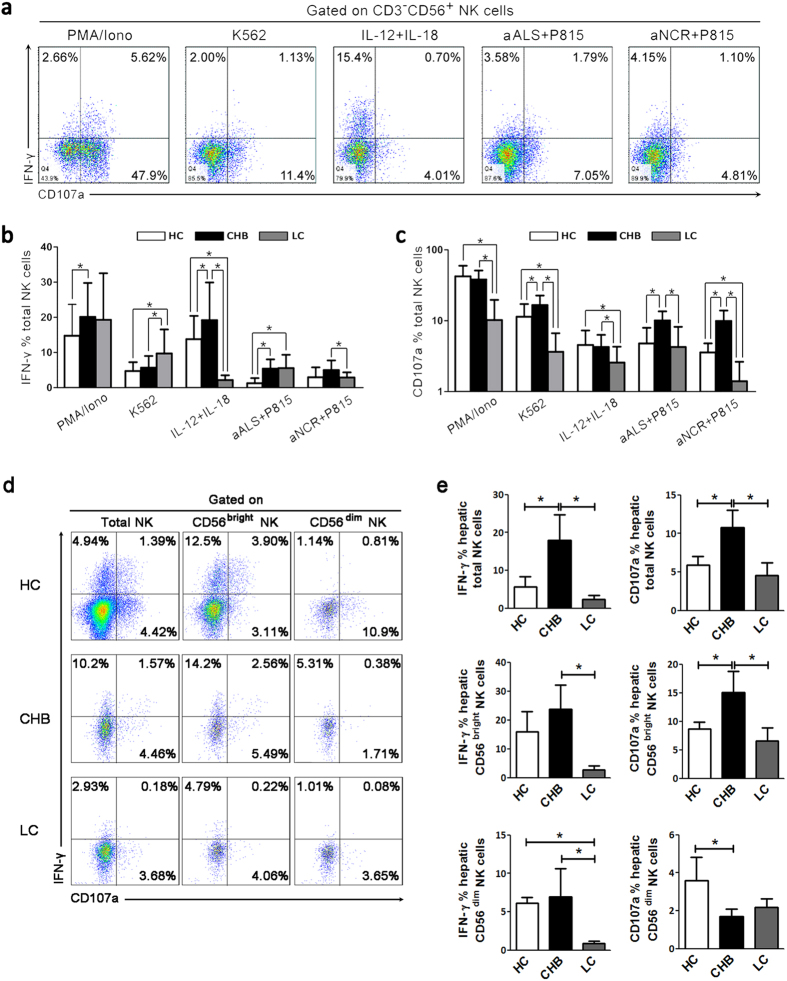
Figure 2. Intrahepatic and peripheral NK cells from LC patients display impaired IFN-γ production and degranulation.
(a) Representative dot plots showing IFN-γ and CD107a expression on peripheral NK cells among the three groups in response to various stimuli. CD3−CD56+ NK cells were gated. Values in the quadrants represent the percentages of CD3−CD56+ NK cells that express IFN-γ and CD107a. (b,c) Pooled data showing the percentages of peripheral CD3−CD56+ NK cells that express IFN-γ (b) and CD107a (c) from the three groups upon various stimuli (n = 25 for HC; n = 30 for CHB; n = 24 for LC). The data are shown as the means, and the error bars represent the SEM. (d) Representative dot plots showing IFN-γ and CD107a expression on intrahepatic total NK cells, CD56bright and CD56dim NK cell subsets among the three groups in response to IL-12 plus IL-18 stimulation. Values in the quadrants represent the percentages of CD3−CD56+ total and CD56bright and CD56dim NK cell subsets that express IFN-γ and CD107a. (e) Pooled data showing the percentages of intrahepatic total NK cells, CD56bright and CD56dim NK cell subsets that express IFN-γ and CD107a from the three groups upon various stimuli (n = 6 for HC; n = 7 for CHB; n = 5 for LC). The data are shown as the means, and the error bars represent the SEM. *P < 0.05, two-tailed, unpaired Student’s t-test.

